EMISSIONS Breakout Report - TEMPO Applications Workshop Insights
This report delves into the applications and potential impact of TEMPO, a groundbreaking project offering real-time emissions observations and data assessments for various industries and sectors. Explore how TEMPO's unique capabilities can enhance existing practices and open doors for new insights in emissions management and monitoring.

Download Presentation

Please find below an Image/Link to download the presentation.
The content on the website is provided AS IS for your information and personal use only. It may not be sold, licensed, or shared on other websites without obtaining consent from the author. If you encounter any issues during the download, it is possible that the publisher has removed the file from their server.
You are allowed to download the files provided on this website for personal or commercial use, subject to the condition that they are used lawfully. All files are the property of their respective owners.
The content on the website is provided AS IS for your information and personal use only. It may not be sold, licensed, or shared on other websites without obtaining consent from the author.
E N D
Presentation Transcript
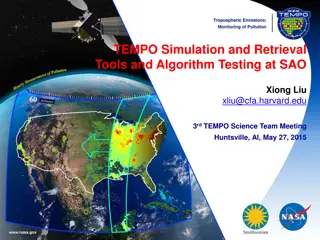
EMISSIONS Breakout Report 1stTEMPO Applications Workshop Huntsville, AL
Question 1: TEMPO will provide first of its kind temporal (1 hourly) and spatial (2-km pixel width in north-south; 4.5-km pixel length in east-west) resolution with limited data latencies allowing for the community to continue existing applications and facilitate new ones. What are the discipline or focus area science questions or application challenges that can be addressed with TEMPO data? Near real-time emissions observations of NOxand aerosols and indirect constraints on primary VOCs (formaldehyde, glyoxal). Top down constraints on temporal and spatial allocations for specific emissions sectors. Using TEMPO as a vehicle for establishing a more effective communication between end-users (e.g. inventory developers) and top down analysis Removes data gaps that are present in current LEO products.
Question 2: There are a number of current in situ and remotely sensed data that measure atmospheric constituents, such as tropospheric ozone (O3), nitrogen dioxide (NO2), aerosols, and other trace pollutants (formaldehyde [H2CO], glyoxal [C2H2O2], and sulfur dioxide [SO2]). Which instruments/observations do you currently use for your work? We need/use all of them.
Question 3: A variety of current and future partners exist in the community. Who are your key partners or end user organizations on tasks, projects, or processes that use NASA satellite data? Who are additional potential users? EPA, NASA, NOAA, DOE, USFS, USDA, DOT, FAA, CDC, NIEH, BOEM State & local agencies Industries Energy Companies Transportation (railroad, shipping, etc.) Urban development/coastal community planning Farming and agriculture Educational, academic agencies
Question 4: Given what you have learned about TEMPO over the last two days, what additional or higher level data products from TEMPO might be useful in your science or applications tasks? (Include the characteristics of the product and other requirements, e.g. resolution, accuracy, data latency, data format.) Rank them in importance. (1) Chemical/meteorological data assimilation or fused data products (e.g. surface concentrations, surface mixing ratio) with TEMPO and other observations at all times. (2) Near real-time emissions estimates (3) Higher spatial resolution derived products (4) Higher temporal resolution derived products
Question 5: Within your organization, what are the biggest impediments limiting your use of new satellite data and products? Time/ease of use Discovery (knowing what all is out there) Understanding/Knowledge of proper application of products These problems could be mitigated by pairing with a product team Need more feedback from end users Data volume/storage
Question 6: What data formats (e.g., NetCDF, HDF, GIS-compatible, etc.) do you need for your science or applications tasks? Given that TEMPO is a factor of 100 greater in data volume than current LEO satellites, we need to think simultaneously about format and tools to use the data. Collaborate with ESIP for large data volume transfer and issues with data formats, etc. What combination of data formats and data visualization will be available and useful. The end users may not be familiar with NetCDF and HDF data formats so they need to be equipped with some data visualization tool.