Emissions Inventory Development Challenges
Explore the issues encountered during the 2014 emissions inventory development, including methodology discrepancies across borders and base year selection dilemmas. Review the checklist points for various emission sources and the differences in modeling protocols. Understand how EPA and states utilize different methodologies for estimating emissions, potentially leading to significant variations in results.

Download Presentation

Please find below an Image/Link to download the presentation.
The content on the website is provided AS IS for your information and personal use only. It may not be sold, licensed, or shared on other websites without obtaining consent from the author. If you encounter any issues during the download, it is possible that the publisher has removed the file from their server.
You are allowed to download the files provided on this website for personal or commercial use, subject to the condition that they are used lawfully. All files are the property of their respective owners.
The content on the website is provided AS IS for your information and personal use only. It may not be sold, licensed, or shared on other websites without obtaining consent from the author.
E N D
Presentation Transcript
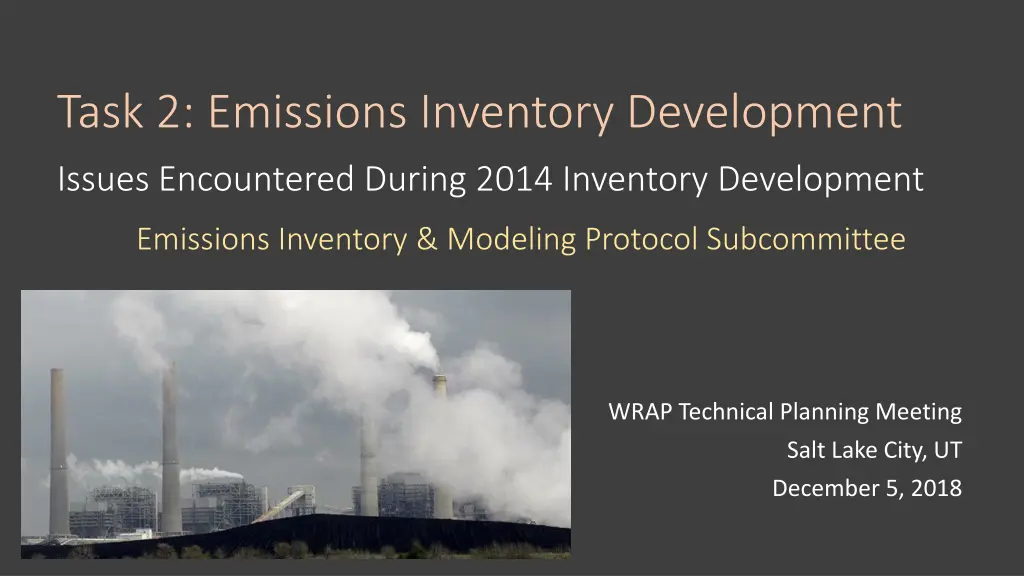
Task 2: Emissions Inventory Development Issues Encountered During 2014 Inventory Development Emissions Inventory & Modeling Protocol Subcommittee WRAP Technical Planning Meeting Salt Lake City, UT December 5, 2018
Emissions Inventory Review Checklist Emissions Inventory Review Checklist Point On-Road Mobile o Activity data (VMT, VPOP, SPEED) o Oil & Gas o EGU o Other Point (non-IPM) o Minors / Non-Majors Non-Road Mobile Biogenic o Land Use o Emission Factors o Modeling Methodology NEI: BEIS; Modelers: MEGAN Non-Point o Area Fugitive Dust o Agricultural Livestock Waste and Fertilizer Application o Agricultural Burning o CMV Onshore and Offshore o Rail o Residential Wood Combustion o Oil & Gas o All Other Fire Events o Wildfire o Prescribed Burning o Reviewed o Not Reviewed by EI Subcommittee
Emissions Inventory Review Emissions Inventory Review Checklist (cont.) Checklist (cont.) Ancillary / Support Modeling Files o Temporal Profiles (and Holidays file) o Chemical Speciation (CB05 or CB06) o Spatial Surrogates o Stack Parameter Lookups o Reference Counties (for On-Road MOVES) o Area to Point (e.g. Airport Operations) Other Review Notes o Pollutants CAPs NOx, SO2, PM10, PM2.5, NH3, VOCs, CO, HAPs / Toxics o Reviewed o Not Reviewed by EI Subcommittee
Base Year Selection Base Year Selection 2014 NEI v2 o Complete with State Input 2016 Modeling Platform o Still in development o Relies on Growth Factors for nonpoint o Little State Input
Methodology Differences Across Borders Methodology Differences Across Borders EPA estimates all emissions categories using one methodology (~ NEI v1) States provide emissions estimates based on better local knowledge or more refined method (~ NEI v2) Potentially different model or calculation method Could use different emission factors, assumptions, activity data, or granular detail (e.g. county vs state-wide factors) Large Differences: Unpaved Road Dust On-Road California wholesale replacement Fire
Methodology Differences Across Borders (cont.) Methodology Differences Across Borders (cont.) MOVES input data submitted (dark)
Methodology Differences Across Borders (cont.) Methodology Differences Across Borders (cont.) Percentage of Emissions in 2014 NEIv2 that was submitted by State or Local agency Point Sources NH3 NOX PM10 PM2.5 SO2 Nonpoint Sources NH3 NOX PM10 PM2.5 SO2 Alaska Arizona 99 94 89 25 92 9 0 0 4 84 90 77 59 97 2 16 1 7 37 Maricopa County CARB Colorado Hawaii Idaho Montana Nevada Clark County Washoe County New Mexico City of Albuquerque North Dakota Oregon South Dakota Utah Washington Wyoming 15 83 53 2 97 72 86 85 84 51 89 76 55 70 95 98 95 99 66 1 3 100 87 91 90 98 99 92 29 33 99 75 34 49 57 65 9 95 100 98 99 100 85 73 94 76 91 5 43 73 78 99 91 4 18 12 3 17 99 94 72 100 55 98 97 91 99 1 74 54 35 79 27 82 1 3 87 73 98 0 0 100 86 97 59 98 2 30 2 11 60 98 66 64 100 96 97 99 97 100 26 76 17 22 19 77 88 93 90 97 4 83 82 83 93 100 99 99 88 100 43 1 3 95
Other Complications Other Complications Different Reporting Thresholds for Point Sources o States may include some, all, or no minor sources Missing Stack Parameters for Point Sources Point Source Representativeness o 5-yr average? New Sources o Typical Year of Facility Activity? Potential problems with EPA MOVES input data (e.g. fleet age distribution) Sector Summaries from EPA not based on NAICS code o A point source may be broken into multiple sectors Augmenting / Regenerating model-ready files State Alaska Arizona California Colorado Hawaii Idaho Montana Nevada New Mexico North Dakota Oregon South Dakota Utah Washington Wyoming Minors Submitted to EPA? Yes (see updates on wiki) Pima County says No AZDEQ: No Yes - All minors submitted for NEI years Yes - All sources down to 1 ton No No Yes Sources down to 25 tons except portables Yes - All minors submitted for NEI years No No No No Yes - All minors submitted for NEI years
Complications for Future Year Modeling Complications for Future Year Modeling How to represent fire events for future years? Point source growth factors to be applied to representative year? What else do we want on this list? International Emissions Do we use EPRI s numbers?


")
")