Empirical Analysis of Innovation in Semiconductors: Has Moore's Law Slowed Down?
This paper by Kenneth Flamm, with comments by Stephen Oliner, examines the pace of innovation in semiconductors. It concludes that the rate of innovation has slowed based on industry data and price trends, particularly for commodity products like DRAM. The assessment also discusses Intel's microprocessors and suggests a divergence from industry trends. The analysis delves into factors affecting DRAM prices, Intel MPU cost trends, and posted price profiles for desktop MPU models.
Download Presentation

Please find below an Image/Link to download the presentation.
The content on the website is provided AS IS for your information and personal use only. It may not be sold, licensed, or shared on other websites without obtaining consent from the author. If you encounter any issues during the download, it is possible that the publisher has removed the file from their server.
You are allowed to download the files provided on this website for personal or commercial use, subject to the condition that they are used lawfully. All files are the property of their respective owners.
The content on the website is provided AS IS for your information and personal use only. It may not be sold, licensed, or shared on other websites without obtaining consent from the author.
E N D
Presentation Transcript
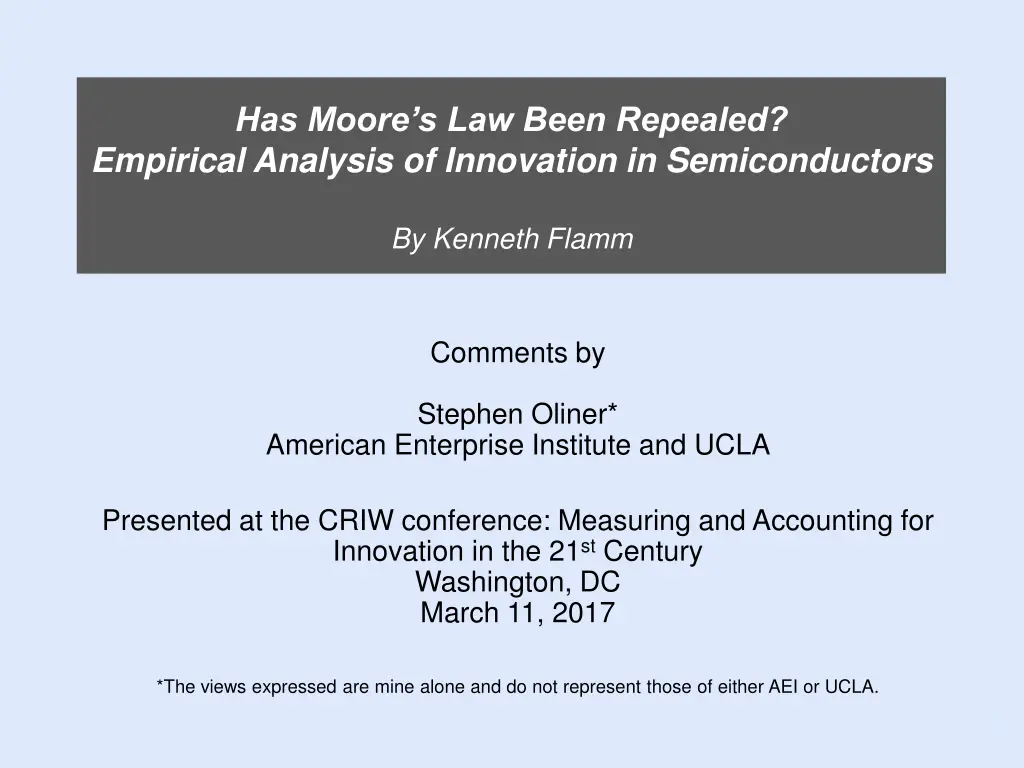
Has Moores Law Been Repealed? Empirical Analysis of Innovation in Semiconductors By Kenneth Flamm Comments by Stephen Oliner* American Enterprise Institute and UCLA Presented at the CRIW conference: Measuring and Accounting for Innovation in the 21stCentury Washington, DC March 11, 2017 *The views expressed are mine alone and do not represent those of either AEI or UCLA. 1
Summary of the Paper and Assessment Paper asks: Has the pace of innovation in semiconductors slowed? Answer: Yes, based on industry data and various price indices Assessment Very nice compilation of industry data on technology, cost, and price trends I m persuaded that advances have slowed for commodity products like DRAM, though extent of slowing open to debate Not persuaded by similar assertion for Intel microprocessors (MPUs). Will devote almost all of my discussion to this topic. o Paper does not grapple seriously with the opposing results for MPU prices in Byrne, Oliner, and Sichel (forthcoming, Review of Income and Wealth) Link o Weight of evidence suggests that Intel has bucked the industry trend 2
DRAM Prices: Supply vs. Demand? DRAMs are a commodity product for which price declines have slowed. Percent change, average annual rate 1995-2000 2000-05 -48% -40% DRAM prices FRB index* 2005-10 -27% 2010-15 -22% *From Federal Reserve Board s Industrial Production data system. Clear slowing after the clockspeed/heat problem appeared in mid- 2000s But is additional deceleration in recent years due to further worsening of innovation trend or to strong demand for cell phones and tablets? Discussion of demand factors would be helpful 3
Intel MPUs: Cost and Price Data Data are not what we d like just a fact of life Cost information Paper cites two Intel presentations on MPU cost/transistor trends o 2015 presentation: no slowing in rate of decline through 2014 o 2012 presentation: rate of decline slowed after 2007 An inconsistent picture not helpful Price data Have posted prices for individual models, but no data on transaction prices. And no data on shipment volumes. Since the cost information is inconsistent, spotlight is on the (imperfect) price data 4
Intel Posted Price Profiles for Desktop MPU Models 2000-01: price profiles slope down the norm with falling quality-adjusted prices 2011-12: price profiles had become almost totally flat. Possible stories: Quality-adjusted prices no longer falling (will show this isn t true) Unobserved discounting that increases as models age No such discounting. Older models sell at high quality-adjusted prices w/ low volume 2011-12 2000-01 Dollars per MPU chip Dollars per MPU chip 1000 1000 1000 1000 900 900 800 800 800 800 700 700 600 600 600 600 500 500 400 400 400 400 300 300 200 200 200 200 100 100 0 0 0 0 2000:Q1 2000:Q3 2001:Q1 2001:Q3 2011:Q1 2011:Q3 2012:Q1 2012:Q3 Implications for price indices 2000-01: Both matched-model (M-M) and hedonic indices will decline over time 2011-12: M-M indices will be nearly flat even if quality-adjusted prices are falling; hedonic indices can capture any such decline. So, hedonic is preferred 5
Matched-Model Price Indices for Intel Desktop MPUs All show dramatic slowing of prices decline consistent with flattening of price profiles Matched-model indices 2000-04 2004-09 2009-13 PPI Flamm* BOS (2017)** -48% -48% -50% -26% -23% -23% -6% -4% -5% *Table 5. The results cover Oct. 2001-Feb. 2004, Feb. 2004-Jan. 2009, and Jan. 2009-July 2014. These periods are the closest approximation to the annual periods in BOS (2017). **Table 2, PPI-like indices for all desktop MPUs. But M-M indices may not be reliable indicators of MPU price change when the profiles are flat (because only use infomation along profiles, not across) 6
Hedonic MPU Price Indices: Modelling Choices How to control for quality? Characteristics vs. performance measures Triplett (1989), Berndt and Griliches (1993): use performance measures if possible because hard to specify correct set of characteristics An industry-standard performance measure exists for MPUs -- SPEC ratings BOS prefer SPEC version of regression but also run a characteristics version. Flamm only uses characteristics. Which posted prices to use? All or only those early in model s life? With flat profiles, concern that older posted prices may be only loosely connected to transaction prices or may have low sales volume Prices early in model s life less susceptible to these issues BOS prefer early-price version but also estimate version with all prices. Flamm only estimates version with all prices 7
Hedonic Price Indices for Intel Desktop MPUs Results using chip characteristics and all prices are similar for Flamm and BOS (lines 1&2): sharp slowdown in price declines Replacing characteristics with SPEC (line 3): much less slowdown Using SPEC and early prices (line 4): price declines don t slow at all! Hedonic indices 2000-04 2004-09 2009-13 Flamm* 1. Chip characteristics, all prices BOS (2017)** 2. Chip characteristics, all prices 3. SPEC performance, all prices 4. SPEC performance, early prices -50% -28% -6% -41% -40% -42% -25% -42% -46% -12% -27% -42% * Table 5, column labelled Hedonic with TDP . The results taken from table 5 cover Oct. 2001-Feb. 2004, Feb. 2004-Jan. 2009, and Jan. 2009-July 2014. These periods are the closest approximation to the annual periods in BOS (2017). ** Table 5. Punchline: Flamm s results don t hold up in a regression that uses an industry- standard measure of performance and is more robust to measurement error. 8
Retail MPU Prices Final part of Flamm s MPU price analysis uses retail prices from the web Good news: these are real prices Bad news: these are low-volume transactions. Not indicative of the prices that Intel s major buyers would pay. Flamm finds no break post-2006 in the relationship between the retail web prices and Intel s posted prices. Flamm s interpretation: Intel s posted prices remained just as informative about transaction prices when the profiles were flat as when they sloped down I agree for low-volume buyers. But we learn nothing about what Dell and other large buyers are actually paying. Hence, not informative about market as a whole. 9
Wrap-up Two parts to the paper First part on the slowing of innovation for commodity semiconductors is illuminating and on-point Second part on whether Intel has escaped this slowdown is misleading Intel does appear to have bucked the slowdown Would suggest some rethinking for this part of the paper 10


