"Discover the comprehensive Future-Readiness Check report for employees, evaluating key factors like flexible working models, resilience, leadership, and more. Use the interactive presentation mode for in-depth analysis and strategic decision-making. Enhance organizational readiness for the future effectively."
Please find below an Image/Link to download the presentation.
The content on the website is provided AS IS for your information and personal use only. It may not be sold, licensed, or shared on other websites without obtaining consent from the author. If you encounter any issues during the download, it is possible that the publisher has removed the file from their server.
You are allowed to download the files provided on this website for personal or commercial use, subject to the condition that they are used lawfully. All files are the property of their respective owners.
The content on the website is provided AS IS for your information and personal use only. It may not be sold, licensed, or shared on other websites without obtaining consent from the author.
E N D
Presentation Transcript
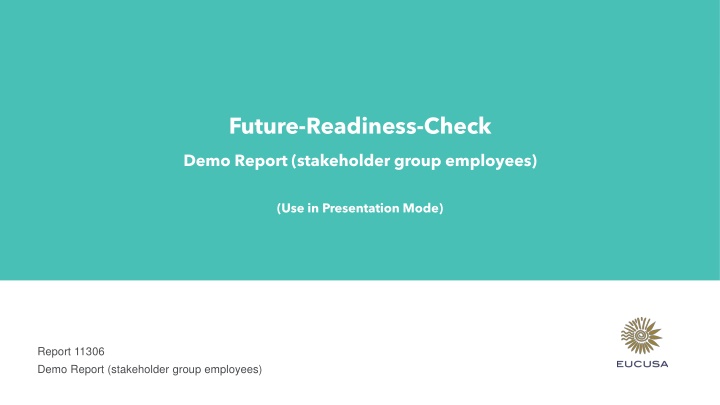
Future-Readiness-Check Demo Report (stakeholder group employees) (Use in Presentation Mode) Report 11306 Demo Report (stakeholder group employees)
% C % C Questionnaire overview Demo Report (stakeholder group employees) E 1: flexible working time models 15: resilience P2_F: Responsibility - Everyone | Managers Future 2: flexible forms of work 16: management culture P3: Competition | Cooperation Now 3: fair remuneration 17: career Development Opportunities P3_F: Competition | Cooperation Future 4: modern IT infrastructure 18: innovation-friendly climate P4: Intelligence | Intuition Now 5: attention to health promotion 19: digitization P4_F: Intelligence | Intuition Future 6: cooperation 20: customer focus P5: New learning | Proven Knowledge Now 7: knowledge management 21: CSR - Corporate Social Responsibility P5_F: New learning | Proven Knowledge Future 8: internal communication 22: attractive employer D1: Leadership 9: trusting working atmosphere 23: product recommendation D2: Seniority 10: unbureaucratic workflows 24: exemplary effect D3: Age 11: security in the supply chain 25: social Benefit D4: Optional password 12: competitiveness P1: Risk | Security Now 13: recruiting P1_F: Risk | Security Future 14: diversity P2: Responsibility - Everyone | Managers Now
% C % C General information Demo Report (stakeholder group employees) E An EUCUSA results report is best used in presentation mode. In the presentation mode the mouse-over functionality and the linking of the graphics is active and allows a quick navigation through the results. The table of contents shows the individual evaluation chapters, which can be accessed directly with a mouse click. On all other evaluation slides, a navigation area can be found in the upper right-hand corner, in which the individual evaluation chapters can be accessed directly. The core of each report is the action portfolio. In the core questionnaire, participants can tick about a quarter of the statements = aspects that are particularly important to them. In the action portfolio, the importance recorded in this way is shown together with the level of agreement. If you mouse-over an aspect, its short text and the values appear in detail. If the point is clicked on, the link takes you directly to the aspect chart, which shows the response distribution and the exact wording of the aspect. The navigation area at the top right takes you back to the action portfolio or to other result charts, which will be explained in more detail in the next slides. The next slides contain more information about the evaluation and the symbolism. For an even better overview of each chart, detailed descriptions of each chart can be found in the PowerPoint notes.
% C % C The EUCUSA traffic light scale Demo Report (stakeholder group employees) E The survey results are presented using a traffic light scale based on theoretical and empirical findings. The color indicates how well the individual perceptions and expectations match (or do not match). A red result means that people have higher or different expectations than they perceive the topic in question to be. The color coding is based on this logic. 1 3 2.4 6 2.9 2.3 6 5 4 3 2 1 EUCUSA uses positive statements to ask about the level of agreement/disagreement. To determine the overall result, the average value of all answers is calculated.
% C % C The symbols Demo Report (stakeholder group employees) E The average rating (mean) of several aspects describing a common phenomenon. The results of an index are represented as a diamond. Index A dimension summarizes various aspects from the questionnaire (=questionnaire chapter). The dimension results can be recognized by the representation as a square. Dimension An aspect describes a specific statement from the questionnaire. The results of aspects are always shown with circles in the report. Aspect 1
% C % C The navigation (1 / 2) Demo Report (stakeholder group employees) E The cockpit (= table of contents) shows the individual chapters of a report, which can be accessed directly with a mouse click. C Content C The project overview (=dashboard) contains the response rate, the overall index and the five strengths/improvement potentials. Project overview The response rate chart shows in detail the rate of invited survey participants who responded to the questionnaire. % Response-Rate % The index overview provides a rough overview of which questionnaire chapters are rated particularly well or critically. Index overview The dimension overview shows percentages of particularly agreeing (light) and disagreeing (dark) responses per dimension. Dimensions The action portfolio shows the degree of agreement for all aspects on the x-axis and their importance on the y-axis. Aspect charts show the response distribution from full agreement to full disagreement in detail, as well as the wording and index. Action portfolio Aspect charts
% C % C The navigation (1 / 2) Demo Report (stakeholder group employees) E The Semantic Differential shows the opinion about ACTUAL and SHOULD BE of pairs of opposites to identify need for change. Semantic Differential In the external benchmarking, the overall result is shown with the best and worst results in the EUCUSA database. External Benchmarking E Table bar charts show differences of a result between demoscopic attributes (e.g. age, gender, affiliation...) Tables bar chart
Content Demo Report (stakeholder group employees) 1) Project overview % 2) Response-Rate % 3) Index overview 4) Dimensions 5) Portfolio of Action 6) Semantic Differential 7) Personal information 8) External Benchmarking E 9) Table Report demoscopic items
% C % C Project overview Demo Report (stakeholder group employees) E Demo Report (stakeholder group employees) Number of emissions: 993 Number of responses: 852 86 % EUCUSA Index 17% 55% 2.6 27% Potential for improvement Strengths 8 9 8 9 internal communication trusting working atmosphere 3 1 3 1 fair remuneration flexible working time models 11 6 11 6 security in the supply chain cooperation 19 16 19 16 digitization management culture 10 22 10 22 unbureaucratic workflows attractive employer
% C % C Response-Rate Demo Report (stakeholder group employees) E 0 10 20 30 40 50 60 70 80 90 100 % Demo Report (stakeholder group 86% 852 / 993 employees)
% C % C Index overview Demo Report (stakeholder group employees) E 2.6 2.6 Corporate Culture 2.3 2.7 2.3 2.7 17% 55% Corporate Image Working Conditions 2.6 27% 2.8 2.7 2.8 2.7 Future Orientation Competitiveness
% C % C Dimensions Demo Report (stakeholder group employees) E 21% 54% Working Conditions 18% 54% Corporate Culture 21% 55% Competitiveness 17% 50% Future Orientation 10% 64% Corporate Image Refusal Agreement
% C % C Portfolio of Action Demo Report (stakeholder group employees) E I=100% (N=157) 2 2 The most important aspects (I) 9 9 17 25 17 8 11 1 25 20 8 3 11 1 6 3 16 6 20 4 16 4 22 22 19 19 7 7 10 10 24 24 23 18 23 13 5 12 18 13 5 12 21 21 15 15 14 14 (3.7) (1.7) Low (6.0) Agreement (A) High (1.0)
% C % C Portfolio of Action Demo Report (stakeholder group employees) E I=100% (N=157) 2 2 The most important aspects (I) 9 9 17 25 17 8 11 1 25 20 8 11 1 3 16 6 20 4 3 16 6 4 22 22 19 19 7 7 10 10 24 24 23 18 23 13 5 12 18 13 5 12 21 21 15 15 14 14 Low (3.7) Agreement (A) High (1.7)
% C % C Action portfolio | Strengths Demo Report (stakeholder group employees) E I=100% (N=157) 2 2 9 trusting working atmosphere 1 flexible working time models 6 cooperation The most important aspects (I) 9 9 16 management culture 17 25 17 8 11 1 25 20 8 11 1 3 16 6 20 4 3 16 6 4 22 attractive employer 22 22 19 19 7 7 10 10 24 24 23 18 23 13 5 12 18 13 5 12 21 21 15 15 14 14 Low (3.7) Agreement (A) High (1.7)
% C % C Action portfolio | Potential for improvement Demo Report (stakeholder group employees) E I=100% (N=157) 2 2 8 internal communication 3 fair remuneration 11 security in the supply chain The most important aspects (I) 9 9 19 digitization 17 25 17 8 11 1 25 20 8 11 1 3 16 6 20 4 3 16 6 4 10 unbureaucratic workflows 22 22 19 19 7 7 10 10 24 24 23 18 23 13 5 12 18 13 5 12 21 21 15 15 14 14 Low (3.7) Agreement (A) High (1.7)
% C % C Working Conditions | Action portfolio Demo Report (stakeholder group employees) E I=100% (N=157) 2.7 2 2 The most important aspects (I) 1 1 3 4 3 4 5 5 Low (3.7) Agreement (A) High (1.7)
% C % C Working Conditions | Aspect list Demo Report (stakeholder group employees) E 2.7 Working Conditions 1 1 2.0 flexible working time models 2 2 2.4 flexible forms of work 3 3 3.6 fair remuneration 4 4 2.6 modern IT infrastructure 5 5 3.2 attention to health promotion
% C % C flexible working time models Demo Report (stakeholder group employees) 1 E 2.0 Our working time models meet the expectations of our employees. (88.3%) full approval 53% N = 452 approval 14% N = 119 light approval 6% N = 48 light denial 6% N = 54 denial 4% N = 38 full denial 5% N = 41
% C % C flexible forms of work Demo Report (stakeholder group employees) 2 E 2.4 Our forms of work (presence versus home office) best suit the requirements of the company on the one hand and the expectations of the employees on the other. (86.5%) full approval 30% N = 256 approval 22% N = 187 light approval 20% N = 167 light denial 5% N = 41 denial 7% N = 62 full denial 3% N = 24
% C % C fair remuneration Demo Report (stakeholder group employees) 3 E 3.6 Our local organization pays fairly. (93.9%) full approval 17% N = 149 approval 15% N = 129 light approval 15% N = 126 light denial 12% N = 100 denial 12% N = 99 full denial 23% N = 197
% C % C modern IT infrastructure Demo Report (stakeholder group employees) 4 E 2.6 The IT infrastructure of our local organization is state-of-the-art and supports us optimally in our work processes. (81.2%) full approval 26% N = 222 approval 22% N = 191 light approval 10% N = 88 light denial 10% N = 85 denial 8% N = 71 full denial 4% N = 35
% C % C attention to health promotion Demo Report (stakeholder group employees) 5 E 3.2 Our local organization pays attention to the physical and mental health of employees and offers sufficient support. (91%) full approval 21% N = 176 approval 16% N = 136 light approval 15% N = 125 light denial 16% N = 133 denial 16% N = 137 full denial 8% N = 68
% C % C Corporate Culture | Action portfolio Demo Report (stakeholder group employees) E I=100% (N=98) 2.6 The most important aspects (I) 9 9 8 8 6 6 7 7 10 10 Low (3.7) Agreement (A) High (1.7)
% C % C Corporate Culture | Aspect list Demo Report (stakeholder group employees) E 2.6 Corporate Culture 6 6 2.0 cooperation 7 7 2.6 knowledge management 8 8 3.6 internal communication 9 9 1.8 trusting working atmosphere 10 10 3.1 unbureaucratic workflows
% C % C cooperation Demo Report (stakeholder group employees) 6 E 2.0 When we work together, we help and support each other in an exemplary manner. (85.6%) full approval 50% N = 428 approval 15% N = 129 light approval 4% N = 38 light denial 6% N = 48 denial 7% N = 56 full denial 4% N = 30
% C % C knowledge management Demo Report (stakeholder group employees) 7 E 2.6 Work-related information is communicated well with us; We like to share knowledge and experience. (90.7%) full approval 23% N = 199 approval 25% N = 210 light approval 23% N = 197 light denial 10% N = 86 denial 7% N = 60 full denial 2% N = 21
% C % C internal communication Demo Report (stakeholder group employees) 8 E 3.6 Important innovations are always communicated clearly, promptly and in the right form. (94.2%) full approval 14% N = 119 approval 16% N = 136 light approval 17% N = 142 light denial 15% N = 129 denial 16% N = 136 full denial 17% N = 141
% C % C trusting working atmosphere Demo Report (stakeholder group employees) 9 E 1.8 The working atmosphere means that we have a high level of trust in one another. (87.2%) full approval 62% N = 527 approval 6% N = 47 light approval 5% N = 46 light denial 6% N = 49 denial 6% N = 54 full denial 2% N = 20
% C % C unbureaucratic workflows Demo Report (stakeholder group employees) 10 E 3.1 Workflows are efficient and unbureaucratic. (93.8%) full approval 17% N = 144 approval 18% N = 152 light approval 20% N = 171 light denial 21% N = 176 denial 12% N = 101 full denial 6% N = 55
% C % C Competitiveness | Action portfolio Demo Report (stakeholder group employees) E I=100% (N=86) 2.7 The most important aspects (I) 11 11 13 12 13 12 15 15 14 14 Low (3.7) Agreement (A) High (1.7)
% C % C Competitiveness | Aspect list Demo Report (stakeholder group employees) E 2.7 Competitiveness 11 11 3.3 security in the supply chain 12 12 2.0 competitiveness 13 13 3.4 recruiting 14 14 2.0 diversity 15 15 2.9 resilience
% C % C security in the supply chain Demo Report (stakeholder group employees) 11 E 3.3 Our local organization is always able to obtain required services and products from suppliers in a timely manner. (85.6%) full approval 22% N = 191 approval 13% N = 107 light approval 11% N = 94 light denial 11% N = 93 denial 15% N = 124 full denial 14% N = 120
% C % C competitiveness Demo Report (stakeholder group employees) 12 E 2.0 The products and services we offer are usually met with high market demand. (83.6%) full approval 49% N = 418 approval 14% N = 116 light approval 5% N = 45 light denial 7% N = 59 denial 5% N = 46 full denial 3% N = 28
% C % C recruiting Demo Report (stakeholder group employees) 13 E 3.4 Our local organization is excellent at recruiting enough new employees with the required knowledge and skills. (94.2%) full approval 20% N = 170 approval 15% N = 129 light approval 14% N = 121 light denial 14% N = 120 denial 13% N = 110 full denial 18% N = 153
% C % C diversity Demo Report (stakeholder group employees) 14 E 2.0 Our local organization is very good at integrating employees from different cultures with different views, ways of life and values. (84.9%) full approval 42% N = 356 approval 25% N = 213 light approval 6% N = 51 light denial 4% N = 34 denial 5% N = 45 full denial 3% N = 24
% C % C resilience Demo Report (stakeholder group employees) 15 E 2.9 Our local organization always adapts to changing market and framework conditions in good time. (92%) full approval 25% N = 210 approval 16% N = 137 light approval 16% N = 137 light denial 19% N = 166 denial 14% N = 117 full denial 2% N = 17
% C % C Future Orientation | Action portfolio Demo Report (stakeholder group employees) E I=100% (N=90) 2.8 The most important aspects (I) 17 17 20 16 20 16 19 19 18 18 Low (3.7) Agreement (A) High (1.7)
% C % C Future Orientation | Aspect list Demo Report (stakeholder group employees) E 2.8 Future Orientation 16 16 2.1 management culture 17 17 2.7 career Development Opportunities 18 18 3.2 innovation-friendly climate 19 19 3.1 digitization 20 20 2.9 customer focus
% C % C management culture Demo Report (stakeholder group employees) 16 E 2.1 Our managers show great appreciation for their employees. (81.5%) full approval 37% N = 318 approval 24% N = 204 light approval 7% N = 61 light denial 5% N = 44 denial 6% N = 47 full denial 2% N = 20
% C % C career Development Opportunities Demo Report (stakeholder group employees) 17 E 2.7 Professional development / further training is very important to us. (89.8%) full approval 21% N = 175 approval 24% N = 204 light approval 20% N = 168 light denial 17% N = 141 denial 7% N = 59 full denial 2% N = 18
% C % C innovation-friendly climate Demo Report (stakeholder group employees) 18 E 3.2 We have an innovation-friendly climate that promotes new ideas through to implementation. (94.1%) full approval 21% N = 183 approval 16% N = 135 light approval 15% N = 125 light denial 17% N = 145 denial 15% N = 127 full denial 10% N = 87
% C % C digitization Demo Report (stakeholder group employees) 19 E 3.1 When it comes to digitalization, we have our finger on the pulse of the times. (90.1%) full approval 18% N = 153 approval 19% N = 163 light approval 20% N = 168 light denial 16% N = 137 denial 8% N = 67 full denial 9% N = 80
% C % C customer focus Demo Report (stakeholder group employees) 20 E 2.9 Our actions are always noticeably geared towards the benefit of our customers (internal and external). (82%) full approval 19% N = 164 approval 18% N = 156 light approval 16% N = 136 light denial 13% N = 110 denial 11% N = 90 full denial 5% N = 43
% C % C Corporate Image | Action portfolio Demo Report (stakeholder group employees) E I=100% (N=88) 2.3 The most important aspects (I) 25 25 22 22 24 24 23 23 21 21 Low (3.7) Agreement (A) High (1.7)
% C % C Corporate Image | Aspect list Demo Report (stakeholder group employees) E 2.3 Corporate Image 21 CSR - Corporate Social Responsibility 21 2.4 22 22 2.2 attractive employer 23 23 2.2 product recommendation 24 24 2.3 exemplary effect 25 25 2.6 social Benefit
% C % C CSR - Corporate Social Responsibility Demo Report (stakeholder group employees) 21 E 2.4 Our local organization always attaches great importance to sustainability, environmental compatibility and compliance rules. (89.6%) full approval 29% N = 250 approval 21% N = 181 light approval 23% N = 195 light denial 8% N = 65 denial 6% N = 47 full denial 3% N = 25
% C % C attractive employer Demo Report (stakeholder group employees) 22 E 2.2 Our local organization is to a large extent an attractive employer. (81.5%) full approval 34% N = 293 approval 26% N = 221 light approval 6% N = 47 light denial 8% N = 65 denial 5% N = 44 full denial 3% N = 24
% C % C product recommendation Demo Report (stakeholder group employees) 23 E 2.2 We can recommend our products and services to friends with a clear conscience. (76.4%) full approval 33% N = 278 approval 21% N = 180 light approval 9% N = 78 light denial 7% N = 58 denial 5% N = 39 full denial 2% N = 18
% C % C exemplary effect Demo Report (stakeholder group employees) 24 E 2.3 The general public speaks positively about our local organization. (83.1%) full approval 36% N = 309 approval 23% N = 199 light approval 6% N = 54 light denial 6% N = 49 denial 6% N = 50 full denial 6% N = 47