Empowering Colleges with AB 705 Data Infographic Template
"This infographic template empowers colleges to input and present their AB 705 data effectively, making key findings accessible for campus audiences. Explore metrics, data definitions, and examples to enhance understanding and drive actionable insights."

Download Presentation

Please find below an Image/Link to download the presentation.
The content on the website is provided AS IS for your information and personal use only. It may not be sold, licensed, or shared on other websites without obtaining consent from the author. If you encounter any issues during the download, it is possible that the publisher has removed the file from their server.
You are allowed to download the files provided on this website for personal or commercial use, subject to the condition that they are used lawfully. All files are the property of their respective owners.
The content on the website is provided AS IS for your information and personal use only. It may not be sold, licensed, or shared on other websites without obtaining consent from the author.
E N D
Presentation Transcript
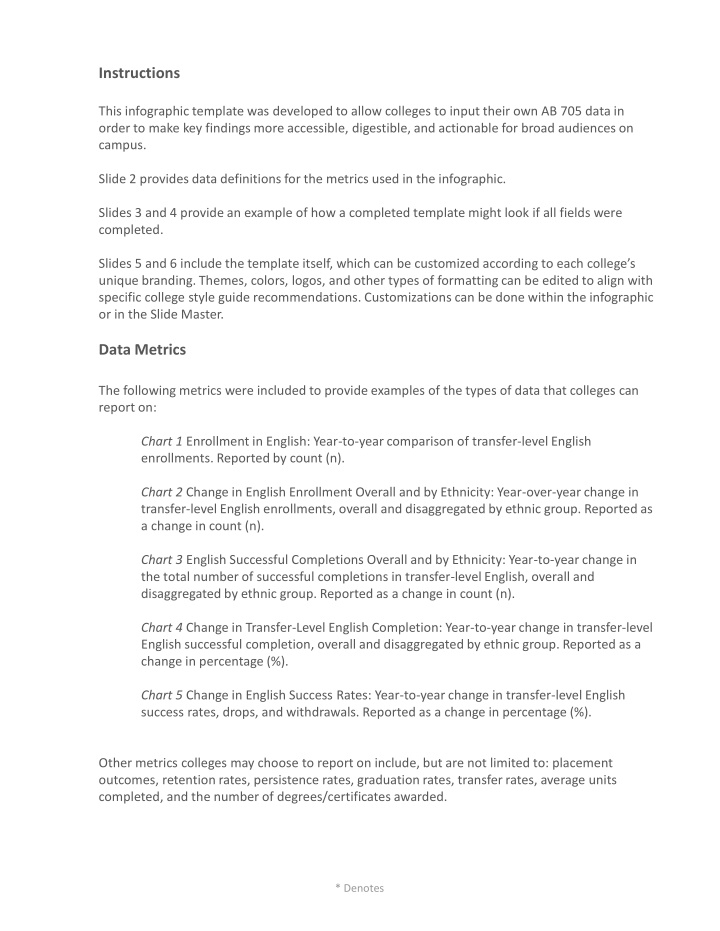
Instructions This infographic template was developed to allow colleges to input their own AB 705 data in order to make key findings more accessible, digestible, and actionable for broad audiences on campus. Slide 2 provides data definitions for the metrics used in the infographic. Slides 3 and 4 provide an example of how a completed template might look if all fields were completed. Slides 5 and 6 include the template itself, which can be customized according to each college s unique branding. Themes, colors, logos, and other types of formatting can be edited to align with specific college style guide recommendations. Customizations can be done within the infographic or in the Slide Master. Data Metrics The following metrics were included to provide examples of the types of data that colleges can report on: Chart 1 Enrollment in English: Year-to-year comparison of transfer-level English enrollments. Reported by count (n). Chart 2 Change in English Enrollment Overall and by Ethnicity: Year-over-year change in transfer-level English enrollments, overall and disaggregated by ethnic group. Reported as a change in count (n). Chart 3 EnglishSuccessful Completions Overall and by Ethnicity: Year-to-year change in the total number of successful completions in transfer-level English, overall and disaggregated by ethnic group. Reported as a change in count (n). Chart 4 Change in Transfer-Level English Completion: Year-to-year change in transfer-level English successful completion, overall and disaggregated by ethnic group. Reported as a change in percentage (%). Chart 5 Change in English Success Rates: Year-to-year change in transfer-level English success rates, drops, and withdrawals. Reported as a change in percentage (%). Other metrics colleges may choose to report on include, but are not limited to: placement outcomes, retention rates, persistence rates, graduation rates, transfer rates, average units completed, and the number of degrees/certificates awarded. * Denotes
Data Definitions Enrollment: Student enrollment is a duplicated count of students. Students may be enrolled in more than one course and would be counted in each course for the term. Includes all valid enrollments including withdrawals and excused withdrawals. Successful Course Completion Rate (Success Rate): The percentage of students who receive a passing grade of A, B, C, P, CR at the end of the term divided by the total number of students enrolled in the course including non passing and withdrawal grades (including excused withdraws). Transfer-Level Course Completion Rates: The proportion of a cohort of students who complete the transferable English course within one full academic year of entering their first course in the sequence. For example, if a student first enrolled in an English course in the fall, they would be tracked through the following summer term. Successful Course Completion (Success Count): The number of students who receive a passing grade of A, B, C, P, CR at the end of the term. Drops: The percentage of students who were enrolled in the class on the start of the term and drop with no grade of record by the drop deadline. Withdrawals: The percentage of students who withdraw, including excused withdraws, from the class after the drop period, but before 80% of the course has been completed, excluding excused withdrawals. * Denotes
Equitable Placement Outcomes: Transfer-Level English As they relate to enrollment, success, withdrawals, drops and transfer-level course completion. Enrollment in ENGLISH 1A increased by 682 students in 4,309 3,627 Overall Enrollment Gains 2018-19 compared to 2017-18 Enrollment in ENGL1A increased 19% overall between 2017- 18 and 2018-19 2017-18 2018-19 Enrollment by Ethnicity ENGL1A Enrollment in English 1A increased for all ethnic groups between 2017-18 and 2018-19 Change in Enrollment Count 2017-18 to 2018-19 Overall Hispanic* Asian +682 +310 +240 + +682 682 Enrollments White Non-Hispanic +60 +31 +19 +13 +9 Filipino African-American* Pacific Islander* American Indian/Alaskan Native* *Denotes DI Group Successful Course Completion by Ethnicity ENGL1A Successful completions in English 1A increased for all ethnic groups between 2017-18 and 2018-19 Change in Successful Completions 2017-18 to 2018-19 Overall Hispanic* Asian +541 +270 +187 +541 +541 Successful Completions White Non-Hispanic +45 +22 +11 +4 +2 Filipino African-American* Pacific Islander* American Indian/Alaskan Native*
Transfer-Level Course Completion Rates Transfer-Level course completion for English 1A increased for all ethnic groups between 2017-18 and 2018-19 Gains in Transfer- Level Completion Overall +11% Completion rates in African-American* +19% ENGL1A increased Asian +16% 11% overall Filipino +15% White Non-Hispanic +12% between 2017-18 Pacific Islander* +5% and 2018-19 Hispanic* +4% American Indian/Alaskan Native* +4% Success rates increased for 1out of 4 DI groups* Success Rates, Drops, and Withdrawals Success rates for English 1A decreased 2% between 2017-18 and 2018- 19, while drops increased 1% and withdrawals decreased 1% Success Rates Drops Withdrawals +1% Withdrawals decreased for 2 out of 4 DI groups -1% -2% Background Information In fall 2019, the English department changed the way they placed students in compliance with equitable placement. Students with a 2.6 high school GPA or higher were placed directly into English 1A. Students with a 1.9 to 2.6 HSGPA were placed in ENGL1A with an optional corequisite and students below a 1.9 HSGPA were required to take ENGL1A with a corequisite. *disproportionately impacted groups ENGL1A Enrollment Ethnicity 2017-18 2018-19 Total 3,627 4,309 African-American 137 156 Asian 1,445 1,685 Filipino 309 340 Hispanic 1,112 1,422 American Indian/Native Alaskan 10 19 Pacific Islander 25 38 White Non-Hispanic 589 649