Endangered Species Herbicide Assessment Case Study
Explore a case study on assessing endangered species impacted by herbicide use, covering direct and indirect effects on various taxa and habitats. The study includes application rates, conclusions on non-target plants and animals, and analysis of potential indirect effects.

Download Presentation

Please find below an Image/Link to download the presentation.
The content on the website is provided AS IS for your information and personal use only. It may not be sold, licensed, or shared on other websites without obtaining consent from the author. If you encounter any issues during the download, it is possible that the publisher has removed the file from their server.
You are allowed to download the files provided on this website for personal or commercial use, subject to the condition that they are used lawfully. All files are the property of their respective owners.
The content on the website is provided AS IS for your information and personal use only. It may not be sold, licensed, or shared on other websites without obtaining consent from the author.
E N D
Presentation Transcript
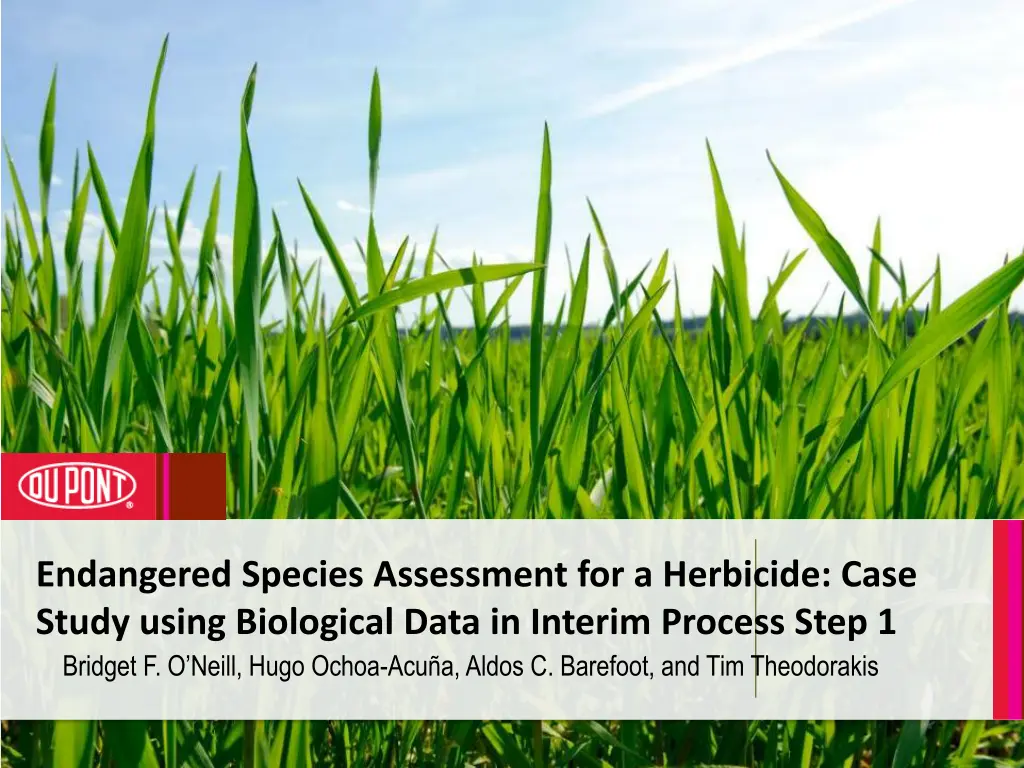
Endangered Species Assessment for a Herbicide: Case Study using Biological Data in Interim Process Step 1 Bridget F. O Neill, Hugo Ochoa-Acu a, Aldos C. Barefoot, and Tim Theodorakis
Background Herbicide 1 is used for the control of annual and perennial grasses Registered for use on numerous crops such as cotton, soybeans, canola, dry beans, lentils, sunflower, flax Use in non crop areas Products are applied as liquid sprays (aerial and ground application equipment). Timing corresponds with weed control at all stages of agricultural production (e.g., pre-emergence, during planting, post-emergence, pre-harvest, and burn down). 2
Application Rates Crops Multiple crops: Highest single application rate: 0.0834 lb ai/A Pineapple: Max. application rate per year/season: 0.4125 lbs ai/A/crop cycle Non-Crop Areas Highest single application rate: 0.11 lbs ai/A 3
Direct Effects Conclusions (EFED) EFED conclusion Receptor type Effect type Non-target plants in terrestrial and semi-aquatic areas May Affect Monocots only Non-vascular Aquatic Plant Species No Effect Vascular Aquatic Plant Species No Effect Freshwater Invertebrates May Affect Chronic only in HI Estuarine/ Marine Invertebrates May Affect Chronic only in PR Freshwater Fish and Amphibians May Affect Chronic only in PR Estuarine/ Marine Fish No Effect Birds, Reptiles, and Land-Phase Amphibians No Effect Mammals May Affect Chronic 4 7/2/2025
Indirect Effects (EFED 2013) Taxon DirectlyAffected TaxonIndirectlyAffected Reasonfor Indirect Effect Change in prey population (food source); Reduction in potential pollinators/seed dispersers Mammals Reptiles, Birds, Plants,Amphibians Fish, Reptiles,Amphibians, Plants, Mammals Reptiles, Fish,Amphibians, Mammals, Birds Change in prey population (food source) Change in prey population (food source) Aquatic Invertebrates Fish All taxa (birds, mammals, reptiles, amphibians, fish, aquatic and terrestrial invertebrates) Change in food sources; change in Habitats Terrestrial Monocots List should focus only on species with clear dependency to monocots based on ER25 values 5
Direct Effects to Mammals Reproduction All uses exceeded the chronic threshold of 1 for small and medium-sized mammals consuming diets of short grass. Exceedances for large mammals (short grass) and/or additional food items (tall grass, broadleaf plants, and arthropods) in the small and medium-sized mammal classes as well. Chronic threshold for mammals consuming fruits, pods, seeds, or vertebrates never exceeded 1. Canola/rape, soybeans, sunflowers 2 apps at 0.111 lb ai/A (7-days) 15g 35g 1000g Short grass Tall grass Broadleaf plants Fruits/pods Arthropods Seeds 2.39 1.09 1.34 0.15 0.93 0.03 2.04 0.93 1.15 0.13 0.8 0.03 1.09 0.5 0.61 0.07 0.43 0.02 6
Direct effects evaluation Taxa identified as No Effect Only species which exceed the threshold for direct effects Spatial screen (county level) States were product is not used NLCD 82 county presence Crop specific county data 1000 ft buffer from NLCD82 Biological data Habits Size class Diet 7 7/2/2025
Direct effects evaluation Monocots Mammals Amphibians (PR) Snail (HI) No effect 1329 No Effect 83 54 5 NLCD 82 counties Counties with Cotton or Sugarbeets or Snap Beans for Processing or Green Peas for Processing or Beans Dry Edible or Soybeans or Sunflower or Canola 1000 ft from NLCD82 171 Biological data Habits Size class Diet 29 8 7/2/2025
Biological Screen - Mammals Weight and length information can be collected for various open sources and these can be related to the T-Rex categories Diets in many cases are also available and can be expressed in standard categories used by EPA Based on product profile, taxonomic groups, such as large mammals or carnivores will have a no effect determination Canola/rape, soybeans, sunflowers 2 apps at 0.111 lb ai/A (7-days) 15g 35g 1000g Short grass Tall grass Broadleaf plants Fruits/pods Arthropods Seeds 2.39 1.09 1.34 0.15 0.93 0.03 2.04 0.93 1.15 0.13 0.8 0.03 1.09 0.5 0.61 0.07 0.43 0.02 9
Direct effects evaluation Consideration of diet (carnivore, Insectivore) and/or size (>1000g) allows to determine no effect from direct exposure to all but one mammal species Aquatic Trichechidae West Indian manatee 200-600 kg` >1000g Very large mammal Aquatic herbivore Aquatic plants Terrestrial Canidae Gray wolf 18-40 kg > 1000g Very large mammal Carnivore Diet dominated by vertebrate prey Terrestrial Canidae Red wolf 20-40 kg > 1000g Very large mammal Carnivore Diet dominated by vertebrate prey Terrestrial Felidae Gulf Coast jaguarundi 4.5 9 kg > 1000g Large mammal Carnivore Diet dominated by vertebrate prey Terrestrial Felidae Ocelot 11.3-15.8 kg > 1000g Very large mammal Carnivore Diet dominated by vertebrate prey Terrestrial Felidae Canada lynx 5.1 17.2 kg > 1000g Very large mammal Carnivore Diet dominated by vertebrate prey Terrestrial Felidae Florida panther 36-60 kg > 1000g Very large mammal Carnivore Diet dominated by vertebrate prey Terrestrial Felidae Jaguar 36-158 kg > 1000g Very large mammal Carnivore Diet dominated by vertebrate prey Terrestrial Mustelidae Black-footed ferret 633 g >35g <1000g Large mammal Carnivore Diet dominated by vertebrate prey Terrestrial Mustelidae North American wolverine 7-32 kg > 1000g Very large mammal Carnivore Diet dominated by vertebrate prey Feeds on nuts from different mast trees, leaves, sprouts, insects Feeds on nuts from different mast trees, leaves, sprouts, insects Feeds on nuts from different mast trees, leaves, sprouts, insects Feeds on flying Coleoptera and Lepidoptera at night Feeds on flying Coleoptera and Lepidoptera at night Feeds on flying Coleoptera and Lepidoptera at night Feeds on flying Coleoptera and Lepidoptera at night Terrestrial Sciuridae Delmarva Peninsula fox squirrel 1062 g > 1000g Large mammal Omnivore Terrestrial Ursidae Grizzly bear 102-324 kg >1000g Very large mammal Omnivore Terrestrial Ursidae Louisiana black bear 92-270 kg >1000g Very large mammal Omnivore Terrestrial Vespertilionidae Gray bat 9 g < 15g Small mammal Insectivore Terrestrial Vespertilionidae Indiana bat 8 g <15g Small mammal Insectivore Terrestrial Vespertilionidae Ozark big-eared bat 7.0-14.0 <15g Small mammal Insectivore Terrestrial Vespertilionidae Virginia big-eared bat 7 - 12 g <15g Small mammal Insectivore Terrestrial Zapodidae Preble's meadow jumping mouse 12 - 30 g < 15g Small mammal Omnivore Feeds on seeds, grasses 10 7/2/2025
Direct effects evaluation Monocots Mammals Amphibians (PR) Snail (HI) No effect 1329 No Effect 83 54 5 NLCD 82 counties Counties with Cotton or Sugarbeets or Snap Beans for Processing or Green Peas for Processing or Beans Dry Edible or Soybeans or Sunflower or Canola 1000 ft from NLCD82 171 No Effect 1 8 8 Habits Size class Diet 29 1 + 11 monocots 11 7/2/2025
Direct Effects to Plants Monocots were more sensitive than dicots All ground and aerial spray drift scenarios exceeded the threshold of 1 for listed and non- listed monocots. Application rates of 0.0695 lb ai/A and higher yielded risk quotients that exceeded the threshold in additional scenarios (run-off dry and semi-aquatic scenarios with ground and 25% Visual Effect (ER25) Control (untreated) aerial applications). Lethal dose is 10-20 times higher than ER25 Dicots did not exceed the threshold of 1 for any scenario. 12
Increasing Realism in Drift Exposures Drift deposition curves- AgDRIFT aerial Tier II 0.6 canola, soybeans, sunflower 1 app at 0.0834 Plant Dry Semi-Aquatic Spray Drift Listed Status F r Type Ground Aerial Ground Aerial Ground Aerial 0.5 a c t Monocot non-listed <0.1 0.26 0.48 0.66 0.57 2.86 Monocot listed 0.17 0.52 0.96 1.3 1.05 5.27 Dicot non-listed N/A N/A N/A N/A <0.1 <0.1 0.4 i o n Dicot listed <0.1 <0.1 <0.1 <0.1 <0.1 <0.1 Very fine to fine DSD 0.3 o f EPA default for DSD Medium to Coarse DSD Coarse DSD a 0.2 p p . Realistic DSDs for typical 0.1 r a t e 0 0 200 400 600 800 1000 1200 Distance from downwind field edge (ft)
Comparison to Interim Thresholds for Plants EPA s modeled distance downwind Modeled distance with coarse DSD Step 1, dicots Step 1, dicots (lowest NOAEC) Ground and aerial: exposure does not exceed Ground and aerial: exposure does not exceed threshold at any distance downwind threshold at any distance downwind Step 1, monocots Step 1, monocots (lowest NOAEC) Ground: 100-200 ft Ground: 20 ft Aerial: >1000 ft Aerial: 350 ft Step 2, monocots (EC25) Step 2, monocots (EC25) Ground: 50-150 ft Ground: 10 ft Aerial: >1000 ft Aerial: 200 ft
Monocots diversity EPA s modeled distance downwind Modeled distance with coarse DSD Step 1, dicots Step 1, dicots (lowest NOAEC) Ground and aerial: exposure does not exceed Ground and aerial: exposure does not exceed threshold at any distance downwind threshold at any distance downwind Step 1, monocots Step 1, monocots (lowest NOAEC) Ground: 100-200 ft Ground: 20 ft Aerial: >1000 ft Aerial: 350 ft Step 2, monocots (EC25) Step 2, monocots (EC25) Ground: 50-150 ft Ground: 10 ft Aerial: >1000 ft Aerial: 200 ft
Assumptions in Drift Models Wind speed is constant Wind direction is constant Surface roughness is low over the entire distance Low growing grass Flat topography No barriers to wind, no intercepting vegetation Equations for drift deposition curves are flat at long downwind distances Curves selected to overestimate measured drift 16
Use of biological data in reaching No Effect decisions Biological data collected in easy to search, referenced databases allows to reach No effect determinations efficiently The use of these data becomes easier as more information is collected and entered into proper form In this example, taxon-specific toxicity and exposure information allowed to reach No Effects decisions for all but one mammal species Modeling drift with realistic inputs reduces estimated exposures 17 7/2/2025


")
")