Energy Affordability Trends in Scotland Winter 2023-24
Explore the key findings from the Consumer Scotland Energy Tracker Winter 2023-24 report, revealing improvements in energy affordability for households in Scotland. Learn about financial management, heating challenges, and awareness of support programs. Stay informed on the latest consumer insights and trends in the energy sector.

Download Presentation

Please find below an Image/Link to download the presentation.
The content on the website is provided AS IS for your information and personal use only. It may not be sold, licensed, or shared on other websites without obtaining consent from the author. If you encounter any issues during the download, it is possible that the publisher has removed the file from their server.
You are allowed to download the files provided on this website for personal or commercial use, subject to the condition that they are used lawfully. All files are the property of their respective owners.
The content on the website is provided AS IS for your information and personal use only. It may not be sold, licensed, or shared on other websites without obtaining consent from the author.
E N D
Presentation Transcript
Consumer Scotland: Energy Tracker Winter 2023-24 business.yougov.com business.yougov.com
Background This report presents quantitative findings from the Consumer Scotland energy tracker. Fieldwork was conducted using YouGov s online research panel. Fieldwork took place from the 25th January 13th February 2024. The sample consisted of 1,609 adults from Scotland aged 16 and over. The sample weighted to be representative of the Scottish population by age, gender, region, social grade, urban vs rural location and Scottish Index of Multiple Deprivation. The sample included a boost of 80 to those living in a rural location, increasing the size of this audience to 382. The results were then weighted back to being representative at the data analysis stage. Previous waves of the survey took place in the Spring, Autumn and Winter of 2022, and the Spring and Autumn of 2023: Spring 2022: 25th 31st March 2022 Autumn 2022: 27th 10th October 2022 Winter 2022: 28th November 13th December 2022 Spring 2023: 2nd 18th March 2023 Autumn 2023: 2nd 18th October 2023 Statistically significant differences wave on wave are shown through the following:
Key Findings Perceived energy affordability for people living in Scotland continues to improve in the Winter 2023-24 wave, with the proportion saying it is difficult for their household to keep up with their energy bills at its lowest level across waves. The proportion saying they are unable to heat their home due to financial concerns, as well as rationing household energy use, are also significantly lower than in Winter 2022. Seven in ten (69%) say they are able to manage their household finances well, while 29% are not managing well. Both of these are slight improvements compared to this time last year. Around a third (35%) say they are finding it easy to keep up with their household energy bills, while 26% say they are finding it difficult. These also represent moderate improvements compared to Winter 2022. 36% state that they cannot afford to heat their home to a comfortable level, while three in five (54%) report they are rationing energy. These figures also represent wave-on wave improvements. Three in ten (29%) say they can t heat their home to a comfortable level because of poor insulation/energy inefficiency, unchanged vs. the previous wave. The proportion reporting they are aware of at least form of financial support to help with the cost of energy is unchanged from Autumn 2023, at 69%. Of those aware of at least one form of support, half (50%) report that they/their household have received at least one type of support to help with the cost of energy.
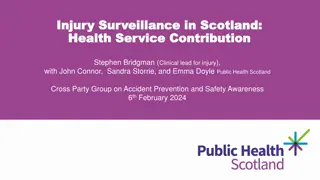
Three in ten report their household is not managing well financially; this is a slight decrease compared to this time last year Those most likely to not be managing: How well household is managing financially Those aged 16-34 (34%) and 35-54 (36%) are more likely to report that they are not managing well than those aged over 55 (19%). 7% 9% 9% 9% Those of a lower social grade (C2DE: 37%) are also more likely to say this, compared to those in social grade ABC1 (19%). Women are more likely to report they are not managing well (33%) compared to men (24%). 22% 22% 24% 24% Prefer not to answer Don't know Those with a disability or long term health condition are more likely to report they are not managing well than those without (38% vs 23%). Among those with a disability or long term health condition, those who report being limited a lot are more likely to report they are not managing well (50%) compared to those who are limited a little (30%). Not managing well at all 59% 57% Not managing well 56% 56% Managing quite well Managing very well 38% Of those not managing well report that they expect their household to be managing worse in three months time. 10% 10% 9% 7% Winter 2022 Spring 2023 Autumn 2023 Winter 2023 HF1. Which of these phrases best describes how you and your household are managing financially these days? Base: All (Winter 2022 n=1,621, Spring 2023 n=1,579, Autumn 2023 n=1,589, Winter 2023-24 n=1,609)
The proportion who say it is difficult to keep up with energy bills has decreased compared with Autumn 2023 and is lower compared with this time last year Ability to keep up with energy bills Very easy Fairly easy Neither easy nor difficult Fairly difficult Very difficult 10% 25% 38% 20% 6% Winter 2023 9% 24% 36% 24% 6% Autumn 2023 7% 20% 37% 28% 8% Spring 2023 Women (29%), those aged 35- 54 (33%) those with a disability (35%) and those in households with incomes below 20,000 (36%) are more likely to say this. 6% 19% 40% 28% 8% Winter 2022 5% 19% 40% 25% 10% Autumn 2022 8% 23% 36% 25% 8% Spring 2022 AFF3. How easy or difficult is it for your household to keep up with your energy bills nowadays? Is it Base: All (Spring 2022 n=2,012, Autumn 2022 n=1,586, Winter 2022 n=1,621, Spring 2023 n=1,579, Autumn 2023 n=1,589, Winter 2023-24 n=1,609)
The proportion who feel it is more difficult to keep up with energy bills compared with this time last year has decreased compared with Winter 2022. Ability to keep up with energy bills compared with this time last year Ways of cutting back on spending to pay for energy bills 58% A lot easier A little more difficult A little easier A lot more difficult No difference General spending 45% Entertainment, holidays, treats 51% 44% 11% 12% 18% 45% 24% 24% 24% Clothes shopping 36% 37% 32% Food shopping 31% 25% House or garden decoration/renovation Replacing old or broken household appliances 30% 38% Winter 2022 26% 43% 42% 45% Winter 2023 24% 21% 17% Transport 45% 46% 9% Other household bills (e.g. insurance, phone bills) 14% 40% 11% 29% 30% 27% 3% 3% 11% Prefer not to say 3% 3% 3% 2% 10% 2% 1% 1% 1% 1% 2% 25% Nothing/none of these 33% Spring 2022 Autumn 2022 Winter 2022 Spring 2023 Autumn 2023 Winter 2023 AFF4. And compared with this time last year, how much easier or more difficult is it for your household to keep up with your energy bills nowadays? Is it AFF5. Are you having to cut back your spending on any of these things in order to afford to pay your energy bills nowadays? Please tick all that apply Base: All (Spring 2022 n=2,012, Autumn 2022 n=1,586, Winter 2022 n=1,621, Spring 2023 n=1,579, Autumn 2023 n=1,589, Winter 2023-24 n=1,609)
There has been a decrease in those who report being unable to heat their home and the rationing of energy use compared with Autumn 23 and is lower compared with this time last year Statements about affordability of energy bills in the present Statements about affordability of energy bills in the present (net agree) Spring 2022 Autumn 2022 Winter 2022 Strongly agree Tend to agree Neither agree nor disagree Spring 2023 Autumn 2023 Winter 2023 Tend to disagree Strongly disagree Prefer not to say 68% 68% 62% 60% We can't afford to heat our home to a comfortable level because of financial concerns 54% 14% 22% 18% 23% 21% 52% 43% 42% 41% 38% 36% My household is rationing our energy use because of financial concerns (e.g. reducing heating, or avoiding using appliances) 31% 29% 19% 35% 15% 14% 16% 28% We can't heat our home to a comfortable level because of poor insulation/energy inefficiency 10% 20% 19% 26% 24% We can't afford to heat our home to a comfortable level because of financial concerns My household is rationing our energy use because of financial concerns (e.g. reducing heating, or avoiding using appliances) We can't heat our home to a comfortable level because of poor insulation/energy inefficiency* AFF9. To what extent do you agree or disagree with these statements: Base: All (Spring 2022 n=2,012, Autumn 2022 n=1,586, Winter 2022 n=1,621, Spring 2023 n=1,579, Autumn 2023 n=1,589, Winter 2023-24 n=1,609) *This statement was only asked in Autumn 2023 and Winter 2023-24
The proportion agreeing their household will have to ration energy and won t be able to afford to heat their home due to financial concerns has decreased, likely as a result of being asked to think about the approaching summer time instead of winter 10 Statements about affordability of energy bills in the future Strongly agree Tend to agree Neither agree nor disagree Tend to disagree Strongly disagree 19% 26% 20% 21% 12% Winter 2022 I/we won't be able to afford to heat my/our home to a comfortable level because of financial concerns 18% 23% 21% 20% 15% Spring 2023 16% 23% 20% 22% 18% Autumn 2023 8% 14% 23% 28% 24% Winter 2023 Women (42%), those aged 35- 54 (42%), those with a disability (44%), and those in households with incomes under 20,000 (51%) are most likely to say their household will have to ration energy use. 25% 36% 16% 13% 8% Winter 2022 My/our household will have to ration my/our energy use because of financial concerns 23% 35% 17% 13% 11% Spring 2023 20% 33% 17% 15% 14% Autumn 2023 11% 25% 21% 20% 21% Winter 2023 AFF14. Thinking about the approaching summer time* and cost of your energy, to what extent do you agree or disagree, if at all, with these statements: *This question previously asked about the winter time Base: All (Winter 2022 n=1,621, Spring 2023 n=1,579, Autumn 2023 n=1,589, Winter 2023-24 n=1,609)
Approximately three in ten (31%) agree their supplier offers a good price for energy and nearly half (49%) say their supplier treats them fairly, marking an increase in both compared with this time last year Agreement statements about energy suppliers Strongly agree Tend to agree Neither agree nor disagree Tend to disagree Strongly disagree 5% 6% 4% 7% 6% 12% 13% 15% 6% 18% 19% 8% 9% 21% 21% 9% 10% 36% 37% 37% 40% 15% 39% 19% 17% 14% 19% 20% 19% 40% 39% 42% 40% 42% 18% 15% 27% 28% 28% 37% 37% 29% 30% 39% 37% 38% 31% 33% 35% 36% 31% 34% 22% 18% 33% 20% 18% 17% 22% 23% 17% 18% 17% 9% 23% 10% 9% 7% 20% 8% 14% 12% 11% 10% 9% 8% 7% 7% 7% 6% 6% 6% 5% 5% 5% Autumn 2022 Winter 2022 Spring 2023 Autumn 2023 Winter 2023 Autumn 2022 Winter 2022 Spring 2023 Autumn 2023 Winter 2023 Autumn 2022 Winter 2022 Spring 2023 Autumn 2023 Winter 2023 Autumn 2023 Winter 2023 The supplier I use is the only one available to me My supplier offers a good price for energy My supplier treats me fairly in their dealings with me My supplier dealt with my issue/query well when I contacted them recently* SER1. When thinking of your energy supplier, how much do you agree or disagree with the following statements? Base: All (Autumn 2022 n=1,586, Winter 2022 n=1,621, Spring 2023 n=1,579, Autumn n=1589, Winter 2023-24 n=1,609) and those who contacted their supplier (Autumn 2023 n=492, Winter 2023-24 n=510) *This statement was added in Autumn 2023
Over half report their energy bills provide guidance on what to do if worried about paying the bill and their supplier makes it easy for them to get in contact if they need to, with both having increased compared with this time last year Agreement statements about energy suppliers Strongly agree Tend to agree Neither agree nor disagree Tend to disagree Strongly disagree 5% 5% 5% 5% 6% 4% 6% 6% 7% 7% 5% 11% 10% 11% 11% 8% 9% 9% 9% 11% 13% 14% 10% 12% 13% 14% 12% 14% 14% 16% 31% 29% 23% 25% 32% 32% 26% 25% 25% 31% 26% 28% 30% 31% 28% 39% 37% 43% 39% 41% 40% 41% 34% 37% 37% 41% 40% 33% 32% 33% 19% 19% 17% 17% 16% 16% 16% 16% 15% 15% 14% 13% 13% 13% 11% Autumn 2022 Winter 2022 Spring 2023 Autumn 2023 Winter 2023 Autumn 2022 Winter 2022 Spring 2023 Autumn 2023 Winter 2023 Autumn 2022 Winter 2022 Spring 2023 Autumn 2023 Winter 2023 The supplier makes it easy for me to contact them if I need to The energy bills I receive provide guidance on what I should do if I am worried about paying my bill The language used in the energy bill I receive is easy to understand SER1. When thinking of your energy supplier, how much do you agree or disagree with the following statements? Base: All (Spring 2022 n=2,012, Autumn 2022 n=1,586, Winter 2022 n=1,621, Spring 2023 n=1,579, Autumn 2023 n=1,589, Winter 2023-24 n=1,609)
14 Metrics such as ease of contact, being treated fairly and offering a good price have stayed consistent compared to last wave Agreement statements about energy suppliers (net agree) Autumn 2022 Winter 2022 Spring 2023 Autumn 2023 Winter 2023 56% 56% 56% 59% 58% The language used in the energy bill I receive is easy to understand 52% 53% 54% The energy bills I receive provide guidance on what I should do if I am worried about paying my bill 57% 57% My supplier dealt with my issue/query well when I contacted them recently* 53% 55% 45% 45% 46% The supplier makes it easy for me to contact them if I need to 52% 51% 43% 44% 42% My supplier treats me fairly in their dealings with me 48% 49% 23% 23% 22% My supplier offers a good price for energy 30% 31% SER1. When thinking of your energy supplier, how much do you agree or disagree with the following statements? Base: All (Autumn 2022 n=1,586, Winter 2022 n=1,621, Spring 2023 n=1,579, Autumn n=1,589, Winter 2023-24 n=1,609) *This statement was only asked in Autumn 2023 and Winter 2023-24
16 Following a decline between Spring and Autumn 2023, awareness of at least one form of financial support is unchanged this wave (69%) Awareness of forms of financial support 48% Winter Fuel Payments 50% 37% Cost of Living Payment 39% 30% Warm Home Discount 30% 22% Disability Cost of Living Payment 21% Age remains a key factor in awareness, with 77% of those aged 55+ having heard of at least one, compared to 64% of under 55s. This gap is driven by higher awareness of a few specific forms of support among older people. 19% Warmer Homes Scotland 20% 17% Pensioner Cost of Living Payment 17% 14% Crisis Grants 13% 9% Low Income Winter Heating Assistance 10% 10% There have also been no statistically significant changes in awareness of individual forms of support wave-on- wave. 85% of those in the lowest income bracket (< 20,000) are aware of at least one of these, compared to 58% in households earning 60,000+. Energy Bill Support Scheme 9% 8% Home Energy Scotland Loan 8% 5% Child Winter Heating Assistance 4% 4% Unlike the previous wave, there is no gap in overall awareness between those in energy debt/arrears and those not (71% vs.70%), driven by declines in reported awareness in certain forms of support among the former group. Social Housing Fuel Support Fund 4% 4% Home Heating Support Fund 3% 2% Energy Company Obligation 2% 2% Fuel vouchers 2% 0% Additional Support Credit Autumn 2023 Winter 2023 0% 31% None of the above 31% APP16a. Have you heard of the any of the following forms of financial support that could be available to help your household with the cost of energy or energy efficiency improvements? Please tick all that apply.* Base: All (Autumn 2023 n=1,589; Winter 2023-24 n=1,609) *Question changed this wave to no longer ask about financial support available to help with the cost of energy this winter
17 Approximately a third (34%) of Scottish adults report that their household has received at least one of these forms of financial support Received forms of financial support (among those aware of each form of support) 23% Winter Fuel Payments 25% 16% Cost of Living Payment 17% As with awareness, age remains a key driver in use of support; 65% of those aged 55 and older report having received at least one of these (34% of 16-34 year olds). 11% Warm Home Discount 10% 10% Disability Cost of Living Payment 9% 5% Pensioner Cost of Living Payment 4% 2% Those with a disability (70%) are also twice as likely to say this (35% of those without), though this is linked closely to age. Warmer Homes Scotland 2% 2% This is again unchanged from the Autumn 2023 wave. Crisis Grants 1% 0% Child Winter Heating Assistance 1% 1% Three in four (75%) of those with household income lower than 20,000 report having received support with the cost of energy (vs. 16% of those with income of 60,000+). Fuel vouchers 1% 1% Home Energy Scotland Loan 1% 0% Energy Company Obligation 1% Among those in energy debt and arrears, 63% have received support, compared to 47% of those not in debt/arrears. 1% Low Income Winter Heating Assistance 1% 0% Social Housing Fuel Support Fund 0% 0% Home Heating Support Fund Autumn 2023 0% 0% Additional Support Credit Winter 2023 0% 53% None of the above 50% APP16b. Have you or anyone in your household received any of the following forms of financial support to help your household with the cost of energy or energy efficiency improvements ? Please tick all that apply. Base: All who have heard of each form of financial support (Autumn 2023 n=1,107; Winter 2023-24 n=1,109)
9% report being in energy debt or arrears Type of energy debt/arrears (among those in energy debt or arrears) 56% of women vs. 38% of men 45% Behind on bills 47% This is consistent with the 8% reporting this in Autumn 2023. Energy debt repayment plan with energy company (including through a bill repayment plan 29% 34% of 35+ vs. 19% of 16-34 26% 23% with disability vs. 9% without 10% Debt recovery action for my energy arrears As was the case in Autumn 2023, those with a household income of less than 20,000 (14%), those with a disability (13%) and younger respondents (aged under 55) (12%) are more likely to say this.* 20% Autumn 2023 I owe money to someone else as a result of borrowing to pay energy costs 26% Winter 2023 19% Length of time in energy debt or arrears 18% for 1-3 months 13% for 4-6 months 4% for 7-11 months 18% for a year or more 24% Credit card debt or overdraft as a result of paying for energy costs 19% 4% Other 5% 6% Prefer not to say 7% *Due to base sizes, demographic analysis is based on combined data from the Autumn and Winter 2023-24 waves AFF20. Are you in energy debt or arrears? By this we mean behind on energy bill payments, repaying debt to your energy supplier, paying debt recovery through a prepayment meter, or owing money to someone else as result of borrowing money to pay for energy costs. Base: All (Autumn 2023 n=1,589; Winter 2023-24 n=1,609) AFF21. What is the nature of your energy debt or arrears? Please select all that apply. Base: All in energy debt or arrears (Autumn 2023 n=119; Winter 2023-24 n=135) AFF22. How long, in months, have you been in energy debt or arrears? Include the total number of consecutive months since your current energy debt or arrears began. Do not include times when you were in energy debt or arrears previously, but paid them off/had them cleared. Base: All in energy debt or arrears (Winter 2023-24 n=135)
Those in energy debt are split on whether they/their household will be able to pay it back Autumn 2023 (% yes) Statements about energy debt 76% I am rationing my energy use at home due to energy debt 77% 16% 7% Those with a long-term health condition are less likely to be confident in their ability to pay their energy debt back than those without (37% vs. 55%).* I am cutting back on other household expenditure to repay my energy debt 75% 22% 4% 74% I am confident I will be able to clear my energy debt or arrears 46% 42% 47% 11% Women are more likely to say they/their household are rationing their energy use due to debt (86% vs 67% of men).* I have experienced legal/debt recovery action etc. due to energy debt 25% 26% 69% 5% *Due to base sizes, demographic analysis is based on combined data from the Autumn 2023 and Winter 2023-24 waves I have been put on a prepayment meter due to my energy debt 15% 16% 78% 6% Yes this applies to me/my household No this does not apply to me/my household Prefer not to say AFF23. For each of the following statements, please indicate whether or not they apply to you/your household. Base: All in energy debt or arrears (Autumn 2023 n=119, Winter 2023-24 n=135)


 agree their supplier offers")