Energy Balance Figures Conversion Process: Uzbekistan to Mongolia
The process involves converting energy balance figures from Uzbekistan to Mongolia. Steps include replacing country names, adjusting supply and consumption data, and finalizing conversions for accurate analysis.
Download Presentation

Please find below an Image/Link to download the presentation.
The content on the website is provided AS IS for your information and personal use only. It may not be sold, licensed, or shared on other websites without obtaining consent from the author. If you encounter any issues during the download, it is possible that the publisher has removed the file from their server.
You are allowed to download the files provided on this website for personal or commercial use, subject to the condition that they are used lawfully. All files are the property of their respective owners.
The content on the website is provided AS IS for your information and personal use only. It may not be sold, licensed, or shared on other websites without obtaining consent from the author.
E N D
Presentation Transcript
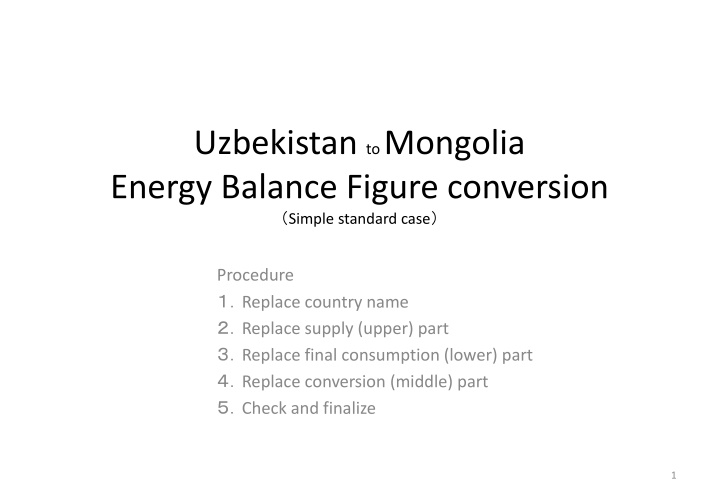
Uzbekistan to Mongolia Energy Balance Figure conversion Simple standard case Procedure Replace country name Replace supply (upper) part Replace final consumption (lower) part Replace conversion (middle) part Check and finalize 1
Uzbekistan Energy Balance, compiled by IEA 2018 data (ktoe) Production | Trade Primary Energy Supply 46393 4 226 507 192 3048 510 1478 129 1199 93 50159 12112 Biomass &Waste 4 Crude Oil 4257 Oil Natural Gas 39374 Hydro & RE 507 Electri city 34 Coal Product 157 2442 5.6 1047(loss) 508 75 6031 2 44 1505 593 59 5887 4239 92 6634? Heat Plant 1470 Eff PP =36.6% CHP=54.1% HP=94.8% 8.3 Power Plant 2394 Convers ion CHP Eff. ? Refinery 1432 2149 6.2 29.0 4191 415(loss) 4597 341(loss) 179(loss) 2723 3703 17643 4 836 FC/PES =63.6% Final Consum ption 29507 54 4 122 509 8002 1169 2818 88 108 4535 1326 1552 443 1079 2857 471 219 3 427 273 1147 255 2030 13 Transport Industry Residential Commercial Others 2 6500 3618 5801 2358 11230
Mongolia Energy Balance, compiled by IEA 2018 data (ktoe) Production | Trade Mongolia supply part Primary Energy Supply 5751 143 39 143 2 881 21380 25520 1390 854 0 0 Biomass &Waste 143 Crude Oil 27 Oil Natural Gas 0 Hydro & RE 39 Electri city 141 Coal Product 1351 4049 Eff PP =36.6% CHP=54.1% HP=94.8% 508 75 6031 2 44 1505 593 59 5887 4239 92 6634? Heat Plant 1470 Eff. ? Power Plant 2394 Convers ion CHP Refinery 1432 2149 6.2 8.3 29.0 4191 341(loss) 415(loss) 179(loss) 3703 836 4 4597 FC/PES =63.6% 2723 Final Consum ption 29507 54 4 122 509 8002 1169 2818 88 108 4535 1326 1552 443 1079 2857 471 219 3 427 273 1147 255 2030 13 Transport Industry Residential Commercial Others 3 6500 3618 5801 2358 11230
Mongolia Energy Balance, compiled by IEA 2018 data (ktoe) Production | Trade Primary Energy Supply 5751 143 2 39 143 881 21380 25520 1390 854 0 0 Biomass &Waste 143 Crude Oil 27 Oil Natural Gas 0 Hydro & RE 39 Electri city 141 Coal Product 1351 4049 Eff PP =36.6% CHP=54.1% HP=94.8% 508 75 6031 2 44 1505 593 59 5887 4239 92 6634? Heat Plant 1470 Eff. ? Power Plant 2394 Convers ion CHP Refinery 1432 2149 6.2 8.3 29.0 4191 341(loss) 415(loss) 179(loss) 1249 Mongolia final consumption part 929 92 555 FC/PES =63.6% 1064 Final Consum ption 3888 40 133 71 27 78 322 291 122 419 14 344 468 410 374 64 709 Transport Industry Residential Commercial Others 4 1225 322 723 591 1027
Mongolia Energy Balance, compiled by IEA 2018 data (ktoe) Production | Trade Primary Energy Supply 5751 143 39 143 881 21380 25520 1390 2 854 0 0 Biomass &Waste 143 Crude Oil 27 Oil Natural Gas 0 Hydro & RE 39 Electri city 141 Coal Product 1351 4049 Mongolia conversion part 99 Eff PP =22.2% CHP=50.5% 3 3197 Power Plant 22 Convers ion CHP 1189 4.4 Statistical differences 76 428 21.3 11.9 252(loss) 75(loss) 49(loss) 929 1249 92 555 FC/PES =63.6% 1064 Final Consum ption 3888 40 133 71 27 78 322 291 122 419 14 344 468 410 374 64 709 Transport Industry Residential Commercial Others 5 1225 322 723 591 1027
Mongolia Energy Balance, compiled by IEA 2018 data (ktoe) (finalization Production | Trade Primary Energy Supply 5751 143 2 39 143 881 21380 25520 1390 854 0 0 Biomass &Waste 143 Crude Oil 27 Oil Natural Gas 0 Hydro & RE 39 Electri city 141 Coal Product 1351 4049 99 Eff PP =22.2% CHP=50.5% 3 3197 Power Plant 22 Convers ion CHP 1189 4.4 Statistical differences 76 428 21.3 11.9 252(loss) 75(loss) 49(loss) 929 1249 92 555 FC/PES =63.6% 1064 Final Consum ption 3888 40 133 71 27 78 322 291 122 419 14 344 468 410 374 64 709 Transport Industry Residential Commercial Others 6 1225 322 723 591 1027


