Energy Economics and Policy Analysis: Taiwan Experience Overview
This publication delves into the interaction between energy, economics, and policy analysis, focusing on Taiwan's experience. Covering topics such as energy sources, economic development indicators, and strategies, it provides valuable insights into sustainable energy practices and global challenges like climate change.

Download Presentation

Please find below an Image/Link to download the presentation.
The content on the website is provided AS IS for your information and personal use only. It may not be sold, licensed, or shared on other websites without obtaining consent from the author. If you encounter any issues during the download, it is possible that the publisher has removed the file from their server.
You are allowed to download the files provided on this website for personal or commercial use, subject to the condition that they are used lawfully. All files are the property of their respective owners.
The content on the website is provided AS IS for your information and personal use only. It may not be sold, licensed, or shared on other websites without obtaining consent from the author.
E N D
Presentation Transcript
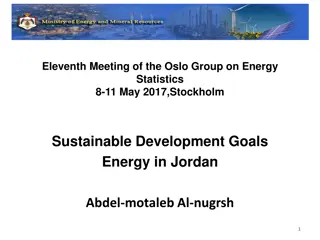
Energy Economics and Policy Analysis: the Taiwan Experience HSU, JYH-YIH DIRECTOR, CENTER FOR INDUSTRIAL DEVELOPMENT RESEARCH PROFESSOR, DEPARTMENT OF MANAGEMENT INFORMATION SYSTEMS PROFESSOR, DEPARTMENT OF APPLIED ECONOMICS NATIONAL CHUNG HSING UNIVERSITY, TAICHUNG, TAIWAN 2012/4/23 1
Outline I. II. Energy and Economic Development 7 III. Electric Power Utility) ........... 29 IV. Analysis .55 V. Current Policy: From IT to ET(Energy Technology)....82 VI. Conclusion .89 Introduction .3 Industry (Public Energy Policy 2
The Role of Energy Major Resource of Industrial and Residential Activities Largest Commodities in Trade for the Modern Economies Main Sources of Environmental Pollution Source: Hsu, Jyh-Yih (2009), Policy for Sustainable Energy Development. 4
Trend of Temperature Anomaly Source Intergovernmental Panel on Climate Change IPCC 5
Energy and Global Warming 1. Fossil Fuels Coal, petroleum and natural gas. 2. Renewable Energy solar, wind, ocean, hydropower, biomass, geothermal, and biofuels 3. Nuclear Energy 4. Electricity vs. Fossil Fuels secondary energy multi-inputs, single output electricity is the key energy for sustainable development 6 Source: Hsu, Jyh-Yih (2009), Policy for Sustainable Energy Development.
II. Energy and Economic Development 7
Taiwans Economic Development Indicators 8 Source: CEPD(2011), Economic Development, R.O.C. (Taiwan)
s hi d i o is o m o bl g Strategies of Economic Development (1/3) a n o st e- c E at e di s g ct e n u m 1950s i d r t o in te o p n r g m o ra hi l r is p u bl 1960s d ul a t n ic st a gr E , a n ks o w c i e e 1970s t n n c g le u n tt d ci o o u b 9 Source: CEPD(2011), Economic Development, R.O.C. (Taiwan) r d
Strategies of Economic Development (2/3) 1980s Economic Liberalization and Technology-intensive Development Restructuring industrial production and expanding R&D spending Pursuing economic liberalization and internationalization Expanding domestic demand to improve the trade imbalance 1990s Coping with Change and Setting New Priorities Implementing the Six-Year National Development Plan to bolster infrastructure Using the BOT approach to encourage the private sector to participate in public construction Promoting telecommunications liberalization Balancing economic and social development to improve living quality Developing Taiwan into an Asia-Pacific Regional Operations Center 10 Source: CEPD(2011), Economic Development, R.O.C. (Taiwan)
Strategies of Economic Development (3/3) 2000s Industrial Renovation and Global Linkage Actively implementing the i-Taiwan 12 Projects to bolster the nation's capital stock by expanding public investment and boosting private investment. Promoting industrial remodeling by developing six major emerging industries and four emerging intelligent industries, building an "intelligent Taiwan," increasing R&D inputs, and creating industrial innovation corridors and new high-tech industrial clusters, to raise the rate of technological progress. Speeding up global connection, enhancing cross-strait and global logistics capabilities, ECFA(Economic Cooperation Framework Agreement) and bringing national economic and trade systems into line with the world, to raise Taiwan's economic efficiency. 11 Source: CEPD(2011), Economic Development, R.O.C. (Taiwan)
Economic Growth Rate 12 Source: CEPD(2011), Economic Development, R.O.C. (Taiwan)
Change in Price Indexes Annual rate of increase (%) 13 Source: CEPD(2011), Economic Development, R.O.C. (Taiwan)
Production Structure 14 Source: CEPD(2011), Economic Development, R.O.C. (Taiwan)
Trade 15 Source: CEPD(2011), Economic Development, R.O.C. (Taiwan)
Trade Partners in 2010 Source: CEPD(2011), Economic Development, R.O.C. (Taiwan) 16
Inward and Outward Foreign Direct Investment 17 Source: CEPD(2011), Economic Development, R.O.C. (Taiwan)
Science and Technology 18 Source: CEPD(2011), Economic Development, R.O.C. (Taiwan)
Infrastructural Development 19 Source: CEPD(2011), Economic Development, R.O.C. (Taiwan)
i-Taiwan 12 Projects (1/2) Twelve prioritized public construction projects to regenerate Taiwan s economic miracle. Investment of NT$3.99 trillion within eight years since 2008. Creating job opportunities for 120,000 people each year. Source: www.cepd.gov.tw/encontent/dn.aspx?uid=7910 20
i-Taiwan 12 Projects (2/2) A Fast and Convenient Islandwide Transportation Network Kaohsiung Free Trade Zone and Eco-Port Taichung Asia-Pacific Sea and Air Logistics Hub Taoyuan International Air City Intelligent Taiwan Industrial Innovation Corridors Urban and Industrial Zone Renewal Farm Village Regeneration Coastal Regeneration Green Forestation Flood Prevention and Water Management Sewer Construction Source: www.cepd.gov.tw/encontent/dn.aspx?uid=7910 21
Geographic Features and Natural Resources POPULATION & NATURAL RESOURCES 36,191 Km2 23,141,628 639 /km2 TOTAL AREA TOTAL POPULATION POPULATION DENSITY RESERVES COAL 103 Million M.T. NATURAL GAS 7 Billion M3 MARBLE DOLOMITE 297 Billion M.T. 110 Million M.T. 367 Million M3 FOREST 22 Source: CEPD(2011), Economic Development, R.O.C. (Taiwan)
Energy Supply in Taiwan Unit % Indigenous Imported Solar Crude Oil and Petroleum Products Conventiona l Hydro Power Coal and Coal Products Solar Thermal Natural Gas Photovoltaic & Wind Power* Nuclear Power Year LNG Total Coal Crude Oil Total 2001 1.26 0.04 0.70 0.45 0.00 0.07 98.74 32.85 50.68 5.73 9.48 - 2002 1.05 0.04 0.69 0.23 0.00 0.07 98.95 33.22 49.48 6.16 10.09 - 2003 0.96 0.04 0.61 0.24 0.00 0.07 99.04 32.71 51.04 6.01 9.27 - 2004 0.86 0.03 0.52 0.23 0.00 0.07 99.14 32.46 51.47 6.73 8.48 - 2005 0.74 0.02 0.36 0.28 0.01 0.07 99.26 32.03 51.82 6.89 8.52 - 2006 0.69 0.02 0.30 0.28 0.02 0.07 99.31 32.47 51.21 7.32 8.32 - 2007 0.66 0.01 0.25 0.29 0.03 0.07 99.34 32.38 51.50 7.43 8.03 - 2008 0.65 0.01 0.22 0.29 0.04 0.08 99.35 32.70 49.88 8.41 8.37 - 2009 0.63 0.01 0.23 0.26 0.05 0.08 99.37 30.50 51.77 8.39 8.71 - 2010 0.61 0.01 0.18 0.28 0.07 0.08 99.39 32.09 49.03 9.98 8.28 - 23 Source: MOEA(2011), TAIWAN ENERGY STATISTICS
Energy Consumption in Taiwan Petroleum Natural Gas Electricity Heat Solar Thermal Coal & Coal TOTAL Year 103 KLOE 103 KLOE 103 KLOE 103 KLOE 103 KLOE 103 KLOE 103 KLOE % % % % % % % 2001 6,713.9 6.92 40,684.6 41.92 2,261.1 2.33 47,290.0 48.72 81.1 0.08 24.7 0.03 97,055.4 100 2002 7,411.4 7.37 41,744.4 41.54 2,332.1 2.32 48,897.4 48.66 84.3 0.08 28.2 0.03 100,497.9 100 2003 7,553.8 7.24 43,525.0 41.70 2,172.7 2.08 50,996.3 48.86 87.9 0.08 33.8 0.03 104,369.5 100 2004 7,561.3 6.95 45,678.0 42.00 2,305.6 2.12 53,088.4 48.81 92.7 0.09 34.1 0.03 108,760.0 100 2005 7,426.0 6.68 45,772.2 41.17 2,300.7 2.07 55,454.7 49.88 97.5 0.09 117.3 0.11 111,168.3 100 2006 7,958.0 7.00 45,537.0 40.04 2,313.7 2.03 57,662.2 50.70 102.4 0.09 165.9 0.15 113,739.3 100 2007 8,764.9 7.35 48,538.3 40.72 2,416.1 2.03 59,156.7 49.63 105.5 0.09 206.8 0.17 119,188.3 100 2008 8,338.0 7.21 45,979.5 39.74 2,489.9 2.15 58,619.6 50.67 109.5 0.09 162.9 0.14 115,699.4 100 2009 7,681.9 6.79 46,759.2 41.35 2,494.3 2.21 55,728.7 49.29 113.2 0.10 295.8 0.26 113,073.0 100 2010 Source: MOEA(2011), TAIWAN ENERGY STATISTICS 10,019.4 8.33 48,395.8 40.23 2,965.7 2.47 58,466.1 48.60 114.3 0.10 346.8 0.29 120,308.0 100 24
Taiwan Energy Supply Structure 25 Source: MOEA(2011), TAIWAN ENERGY STATISTICS
Taiwan Energy Consumption Structure 26 Source: MOEA(2011), TAIWAN ENERGY STATISTICS
Growth Rate of Energy Consumption and Real GDP 27 Source: MOEA(2011), TAIWAN ENERGY STATISTICS
Sustainable Development Sustainable development is a pattern of resource use, that aims to meet human needs while preserving the environment so that these needs can be met not only in the present, but also for generations to come. Key Question: Can economic development be sustainable? 28
III. Electric Power Industry (Public Utility) 29
Public Utility Role and Importance of the Public Utility Significance of the Public Utility Policy Studied Scope The Core Value of Public Utilities Supply Planning of the Public Utility Demand Management of the Public Utility Utility Pricing Policy and Regulation Utility Deregulation Policy 30
The Core Value of Public Utilities(1/2) Option Demand /Value a non-use value, a potential value, an external economy Anytime Option always reliable; instantly available Anywhere Option all those pipes/wires and meters coverage areas Any Amount Affordable due to stable tariffs and depend on the consumer s budget constraint, energy conservation consciousness, lifestyle and weather conditions 31
The Core Value of Public Utilities(2/2) Outage Cost Very High (Reflecting the Loss of Option Demand and Option Value) Shadow Price (Marginal Utility) Very High During Shortage Shadow Price (Marginal Utility) Close/Equal to Zero When Abundant Marginal Cost Normally Very Low (Reserve Margin Is Very Important) 32
Supply Planning of the Public Utility(1/5) Attributes of the Utility Supply Natural Monopoly (AC Decreases When Scale Increases), i.e. Economy of Scale Capital-Intensive (e.g. Electric Utility Alone Represents More Than 30% of the Total Capital Formation in Developing Countries) Supply Is Subject to Meet the Needs of Demand (Reserve Margin Needed) Long-term Planning with Significant Lead Time Large Land Requirement (Social Capital Assets Utilized for Piping Networks) Electric Power: Multi-inputs for Producing A Single and Homogeneous Output 33
Supply Planning of the Public Utility(2/5) Evaluation of the Feasibility of Supply Alternatives Technical Feasibility Economic Feasibility Financial Feasibility Environmental Feasibility The General Public s Acceptance Feasibility 34
Supply Planning of the Public Utility(3/5) Key Concepts of Public Utility Economics Economic Cost vs. Accounting Cost of Supply Alternatives Economics of Single Alternative vs. Economics of the Whole System vs. Economics of the Nation Optimization (Global Optimization) vs. Simulation (Local Optimization) for Supply Alternatives NPV vs. BCA vs. IRR of Supply Alternatives Environmental Cost and Others External Costs (Direct/Indirect, Plant on-site/off-site, Tangible/Intangible) Benefits Should Be Also Considered Importance of Option Demand and Option Value 35
Supply Planning of the Public Utility(4/5) Taiwan s Experience Least-Cost(Cost-effective) Planning Approach Ad hoc Review Committee for Supply Alternatives Selection (e.g. Power Generation Alternatives) Environmental Concerns Highly Increased (e.g. Kyoto Protocol on CO2 Emission and Circulation- type of Resource Uses, and WEEE, RoHS, EUP) Nuclear, Coal-fired and Hydro Power Plants Not Easily Accepted by the Environmentalists and the General Public 36
Supply Planning of the Public Utility(5/5) Taiwan s Experience Renewable Power Generation Being Promoted by Laws and Government s Measures LNG Power Plant Also Exists Problems, e.g. Storage Terminals and Piping Transmission Water Shortages Occasionally Happened and Causes Great Social and Political Concerns 25 City Gas Utility Companies are not Enough Economy-of-Scale 37
Demand Management of the Public Utility(1/4) Attributes of the Utility Demand Collective Consumption Inelasticity of Demand Market Segmentation by Piping (e.g. Voltages or Pressures) and Meters Derived Demand Normally Greater Than Final Demand (e.g. Taiwan s Experience) 38
Demand Management of the Public Utility(2/4) Economics of Outage Cost Importance of Outage Cost Economic Meanings of Outage Cost (Social Cost, Shadow Price and WTP) TC (Total Cost) = SC (Supply Cost) + OC (Outage Cost) Diagram of the Above Equation Types of Outage Cost 39
Demand Management of the Public Utility(3/4) Demand-Side Management (DSM) Economic Meaning of DSM (Industries, Processes, End- uses; Households, Activities, End-uses) Objectives of DSM Alternatives of DSM (e.g. Electric Power TOU Rate, Seasonal Rate, Interruptible/Curtailable Rate, Direct Rebate, Commercial Advertisement, Education, ESCo. etc.) Evaluation/Selection of DSM Alternatives Enforcement of DSM Evaluation/Adjustment of DSM Program 40
Demand Management of the Public Utility(4/4) Taiwan s Experience TOU Electric tariff Seasonal Electric tariff 7 Types of Interruptible/Curtailable Electric Rate Air-Conditioning Ice-Cooling Storages and Heat Pumps Significant Amount of Cogeneration (16.3% in 2010) Fuel Cells under Promotion ESco Being Encouraged Education and Promotion on Energy/Water Conservation, e.g. Conservation Ideas/Pictures/Figures Printed on the Electricity and Water Bi-Monthly Bills 41 Source: www.tri.org.tw/ele/page/03.html
7 Types of Interruptible/Curtailable Electric(1/2) Scheduled Load Reduction Program (A) From May to December, 1 weekday per week, 10:00 a.m. ~ 5:00 p.m., totally 7 interruptible hours per chosen interruptible day. 20% discount on demand charges for contracted reduction load. Scheduled Load Reduction Program (B) Free to choose from May to October. 10:00 a.m. ~ 12:00 a.m. and 1:00 p.m. ~ 5:00 p.m., totally 6 interruptible hours per day. 10%~ 75% discount on yearly demand charges for the contracted reduction Scheduled Load Reduction Program (C) Free to choose from July to October. 8 day per month, 10:00 a.m. ~ 5:00 p.m., totally 7 interruptible hours per chosen interruptible day. 40% discount on demand charges for contracted reduction load. Scheduled Load Reduction Program (D) Free to choose from August to September . Free to choose form 1:00 p.m. ~ 3:00 p.m. per weekday. 30% ~50% per interrupted billing month discount on demand charges for the contracted reduction load. 42
7 Types of Interruptible/Curtailable Electric(2/2) Forced Load Curtailment Program (E) Interrupt load demand accordingly on receipt of TPC s 2-hour advance notice. Rate discount on demand charges for contracted curtailment load is 20%~40% per request. Forced Load Curtailment Program (F) July to June of next year, , Interrupt load demand accordingly on receipt of TPC s request, extent of 25 requests/250 hours per contract year. Rate discount on demand charges for contracted curtailment load is 20%~55% per request. Forced Load Curtailment Program (G) July to June of next year, Interrupt load demand accordingly on receipt of TPC s request, extent of 40 requests per contract year. Rate discount on demand charges for contracted curtailment load is 10% per request. 43
Utility Pricing Policy and Regulation (1/8) Impacts and Principles of Utility Pricing Impacts of Utility Pricing on Social-Economic Development Welfare of the general public The development of Rural Areas The competitiveness of Industries The fiscal situation of governments for those state- owned utilities. 44
Utility Pricing Policy and Regulation (2/8) Impacts and Principles of Utility Pricing Principles for Setting Utility Tariffs Economic efficiency Fairness among consumer groups Fair rate of return for the utility Other social-economic objectives (e.g. discount rates for military, rural or power plant-site consumers). 45
Utility Pricing Policy and Regulation (3/8) Pricing Models of a Natural Monopolist MC = MR (Profit max) Pc MC = P (welfare max) Pa AC = P (fair return) Pb Second Best Pricing (Ramsey pricing)(Cost-plus Pricing) Price-cap Method Most Utility Policies Adopt Cost-plus Regulatory Scheme 46
Utility Pricing Policy and Regulation (4/8) P MR: Marginal Revenue AR: Average Revenue MC: Marginal Cost AC: Average Cost Pd C Pc B Pb D AC P E A MC Pa AR MR Q Qa Qc Qb 47
Utility Pricing Policy and Regulation (5/8) Problems of Cost-Plus Pricing Allocative Inefficiency (MC not equal to P) Technical Inefficiency (eg. A-J Effect) X-inefficiency Moral Hazard Adverse Selection Incentive Compatibility Needed 48
Utility Pricing Policy and Regulation (6/8) Utility Tariffs in Practice Industrial Users Two-Part Tariff Capacity charge (and customer charge) Energy charge Peak-load vs. off peak-load pricing (time of use; TOU) Residential Users Single charge/Energy charge Accumulated increasing block rates (for conservation and distributive justice of the low income groups) Interruptible and curtailable rates for specific users 49
Utility Pricing Policy and Regulation (7/8) Taiwan Experience Cost-plus Regulation Administrative control and implemented measures by MOEA Prudent review procedures Used and useful accounting principle Accumulated increasing block rates of electric utility supply 50


")
")


")
")


")
")
")
")
")
")
")
")
")
")
")
")
")
")
")

")
")
")
")