Energy Scenario Planning Tool Overview
Importance of planning tools in energy scenario analysis, benefits, and applications of the scenario tool, initial feedback questions for stakeholders, and collaboration between DOE's EERE and island utilities in developing the tool for renewable energy solutions.

Download Presentation

Please find below an Image/Link to download the presentation.
The content on the website is provided AS IS for your information and personal use only. It may not be sold, licensed, or shared on other websites without obtaining consent from the author. If you encounter any issues during the download, it is possible that the publisher has removed the file from their server.
You are allowed to download the files provided on this website for personal or commercial use, subject to the condition that they are used lawfully. All files are the property of their respective owners.
The content on the website is provided AS IS for your information and personal use only. It may not be sold, licensed, or shared on other websites without obtaining consent from the author.
E N D
Presentation Transcript
Energy Planning and Implementation: Energy Scenario Planning Tool Overview 07 February 2017
Topics: Importance of Planning Tools Benefits and Applications Initial Feedback Conversation Tool Overview, Principles, and Concepts LCOE Model Review Wrap-up and Feedback
Importance of Planning Tools Benefits of planning tools: Provide key decision information about impacts of various technologies, overall system costs and renewable penetration levels Allows stakeholders to understand the long-term impacts of investment choices Allows for comparative analysis between scenarios on various components such as cost and renewable penetration levels Benefits of using in-house planning tools: Allows the user to create as many scenarios as needed and modify at any time when new or modified data becomes available Users have access to the tool at any time, when updates are needed or to showcase scenarios to stakeholders
Benefits and Applications of the Scenario Tool Benefits: Automatically pulls in supply resource, financial cost data, and capacity factors Easily exportable data inputs and outputs with one-click Applications of the Tool: Integrated Resource Planning Supplements the IRP Toolkit Tool provides data for: forecasting demand, energy generation, energy sources, renewable goal targets, etc. Renewable Energy Integration Energy Cost and Investment Analysis
Initial Feedback Discussion Questions to Consider: What is your function (utility, regulator, investor, etc.)? What types of analyses are you currently working on (scenario analysis, load forecasting, feasibility studies, etc.)? What types of analyses are you planning for in the future? What renewable energy challenges do you face? What challenges do you have in the IRP process?
Introduction DOE s EERE and various island utilities worked together to build the Scenario Tool and Levelized Cost of Energy (LCOE) Model Scenario Tool allows for the creating and analysis of generation scenarios in multiple locations LCOE Model can be used to supplement the Scenario Tool. It calculates a simple levelized cost for renewable energy solutions to the grid by technology for each island in Hawaii, the Caribbean, and the Pacific Target Audience: island utilities, energy ministries, others with responsibilities for planning Purpose of the session: To provide an appropriate background on the functionality of the Scenario Tool and LCOE model and its applications for future generation planning Working with the Tool: A practical exercise working with the Scenario Tool is planned for Thursday
Scenario Tool Overview High-Level Overview: The Scenario Tool allows the user to model a generation scenario for up to a user-specified number of years, including various locations (i.e., islands) and designating amounts of current renewable and non-renewable generation and goals for renewable energy and energy efficiency targets for the future Basic Inputs and Outputs Inputs: scenario and locations, current demand (MWh), maximum resource potential by location (MW), renewable energy projects (resource, year online, capacity in MW, by project), total non-renewable generation capacity (MW or Mbtu), distribution among non-renewable energy types (%) Outputs: Energy Targets (clean and RPS) met or not met, energy costs and investments, electricity demand and supply, supply and distribution by energy resource, energy efficiency outputs, financial details by energy source
Scenario Tool Principles and Concepts Clean / Renewable Energy Targets: Clean energy targets include renewable generation and avoided demand due to energy efficiency. Renewable Portfolio Standard targets include renewable generation Shared Resources: Shared resources can be used to model generation that is used by multiple grids, such as when a cable is used between islands. Assumption: Resources can be shared among location (up to 3) Demand: Total demand is the sum of projected electricity demand and additional demand from electric vehicle consumption (optional), less avoided demand due to energy efficiency. Assumption: Energy efficiency is modeled as avoided demand Non-Renewable Generation: Non-renewable generation can also be used to meet demand. The tool calculates the difference between annual demand and supply met by renewable generation projects to determine the generation required by non-renewable sources. Energy Investments: planned renewable energy investments, energy efficiency, grid upgrade investments Other Energy Costs: Existing renewable energy project costs, non-renewable energy costs Levelized Cost of Energy: Generation cost per kWh Note: The tool is not meant to provide absolute values or make any predictions about the absolute costs of technologies; rather it provides value for comparative analysis between scenarios
Outputs of the Tool Dashboard Data Check, Energy Targets
Outputs of the Tool Dashboard Energy Distribution by Energy Source & Energy Efficiency Impacts
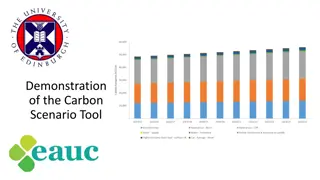
Outputs of the Tool Dashboard Generated Supply by Energy Source
Outputs of the Tool Dashboard Energy Distribution Chart
Outputs of the Tool Dashboard Scenario Energy Costs and Investments
Levelized Cost of Energy (LCOE) Model Review The LCOE Model can be used to supplement the Scenario Tool LCOE is calculated on the basis of a mock renewable installation and analyzing the costs per unit of energy produced The model calculates the cost of delivering renewable energy to the grid (installation and maintenance) Aggregates capital cost and capacity factor data by technology for each island in Hawaii, the Caribbean, and the Pacific The optimal use of LCOE calculations is to compare differences in cost between technologies LCOE should not be used for project level decisions as it does not include cost considerations like taxes/subsidies or the effects of depreciation
LCOE Data Points (included in back-end) Data Point Methodology Data Selected Capital Expenditure Cost Installed MW capacity capex costs calculated for estimated year of RE project install using historical, reported or estimated timeline data (includes construction costs) Varies by technology and island/region Operation & Maintenance Cost Operations and maintenance costs applied using percentages calculated by taking the median from several reputable sources Varies by technology Variable Costs Variable costs applied using percentages calculated by taking the median from several reputable sources Varies by technology Capacity Factor Factor applied to generating capacity of each technology Varies by technology and island/region Lifetime Useful life periods applied to all RE technology projects to enable calculation of replacement cost Varies by technology Loan Tenor Loan lengths for Solar and Wind projects projected at 20 years using bonds matched to PPA. Varies by technology Debt/Equity Financing Capex costs for RE projects used to calculate detailed finance costs including application of debt/equity ratio Varies by technology Import Tariff Tariff applied to equipment imports; applies only to the Caribbean Varies by technology Equipment Percentage of Cost Portion of the capital cost that covers equipment costs; used for calculating import tariff Varies by technology Interest Rates Interest rates applied for debt portion of financing throughout loan term (7%) 7% Cost of Equity Cost of equity applied (10%) 10% General Assumption Constant dollars (i.e., 2015 dollars) for all cost components discounting and inflation not appropriate; no assumptions made about future price changes or effectiveness in RE technologies; no impact from subsidies or taxes; no estimate for cost of land, permitting, or other development costs 2015 dollars
LCOE Technologies, Regions, and Islands Technologies: Geothermal Biomass Solar: Residential, Commercial, Utility Wind: Small, Onshore, Offshore Hydro: Small, Large Municipal Solid Waste Caribbean Islands: St. Lucia Bahamas Turks & Caicos Grenada Puerto Rico USVI BVI Aruba San Andres Dominica St. Kitts & Nevis Belize Regions: Hawaii Caribbean Pacific Hawaiian Islands: Hawaii Maui Lanai Molokai Oahu Kauai Pacific Islands: American Samoa Guam Commonwealth of Northern Mariana Federated States of Micronesia Marshall Islands Palau
LCOE User Inputs User selects: Region: Hawaii, Caribbean, or Pacific Island: Name Data Source: Region-specific, Island-specific, EIA, NREL, etc.
Wrap-Up: Summary and Review Summary: Scenario Tool: Allows to user to model a generation scenario for up to a user- specified number of years, including various locations (i.e., islands) and designating amounts of current renewable and non-renewable generation and goals for renewable energy and energy efficiency targets for the future LCOE Model: Can be used to supplement the Scenario Tool. It calculates a simple levelized cost for renewable energy solutions to the grid by technology for each island in Hawaii, the Caribbean, and the Pacific Benefits and Applications: Automatically pulls in supply resource, financial cost data, and capacity factors Integrated Resource Planning Renewable Energy Integration Energy Cost and Investment Analysis


 Model Review")
")