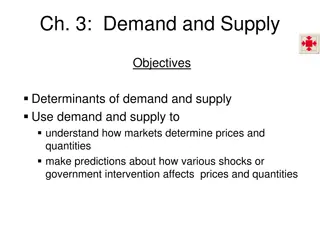
Energy Services and Demand Analysis
Energy services and demand analysis explore the sectors, subsectors, and end-uses driving energy consumption. It delves into forecasting and backcasting methodologies to understand societal energy needs and desired outcomes. The process involves identifying socio-economic activities influencing energy consumption, organizing energy consumption structures, and disaggregating activities to determine fuel consumption and energy intensity levels.

Download Presentation

Please find below an Image/Link to download the presentation.
The content on the website is provided AS IS for your information and personal use only. It may not be sold, licensed, or shared on other websites without obtaining consent from the author. If you encounter any issues during the download, it is possible that the publisher has removed the file from their server.
You are allowed to download the files provided on this website for personal or commercial use, subject to the condition that they are used lawfully. All files are the property of their respective owners.
The content on the website is provided AS IS for your information and personal use only. It may not be sold, licensed, or shared on other websites without obtaining consent from the author.
E N D
Presentation Transcript
ENERGY SERVICES AND DEMAND (CHAPTER 3) Lecture 4 SEPPA (Some slides are from LEAP slides, SEI) Amrit Nakarmi PhD Professor & Coordinator Energy Systems Planning & Analysis, CES/IOE/TU 03 Aug 2016
ENERGY SYSTEMS Transport, storage & Distribution End use conversion Extraction Conversion End-use Energy Supply Energy Demand
SEI Forecasting & Backcasting ? Where is society going? forecast ? Where do we want to go? How do we get there? backcast
SEI Simple Energy Demand Analysis in LEAP Identify the socio-economic activities that drive the consumption of energy. Organize structure of energy consumption into a hierarchical tree . Example: Sectors, Subsectors, End-Uses, Fuels/Device Typically, specify overall activity levels at top of tree. Example: total number of households, industrial value added, etc. Disaggregate total activities down to lower levels of the tree. (e.g. 30% of households are urban, and of these 45% have refrigerators). At lowest levels in tree, specify the fuels consumed by each device and assign an annual energy intensity (e.g. 10 GJ/household for cooking with LPG stoves).
Sectoral, sub-sectoral and end-use breakdowns End-use sectors & their sub- categories Agriculture construction Mining Manufacturing Service sector Energy Hoousehold Transport Freight transport Food, beverage & tobacco Commerce & tourism Grain crops Urban It consists of truck/tankers, Tractors, and pick-ups. Freight Family House Textile & leather goods Community & social servcie Intercity transport Cash crops Intercity The intercity transport consists of 10 modes: airplanes, car gasoline, car diesel, Car alcohol, bus large, bus small, train diesel, Train electric, mini bus & microbus. Dwelling on rent Chemical, rubber & plastics Finance & real estate Livestock Intracity Rural Mechanical engineering goods Intra-city transport Industrial sector The intra-city transport consists of 13 modes of transport: car gasoline, car Diesel, car alcohol, vehicle LPG, car electric, Bus diesel, bus CNG, metro, trolley bus, mini bus, Microbus, tempo Ithree wheelers), motorcycles (two wheelers) Energy uses in household Village house Industrial sector consists of four groups: Agriculture, construction, mining, and manufacturing. (it contains energy sector which also contains transport & communications) Electric engineering goods Energy uses in household sector consist Of space heating and cooling, cooking, Hot water & appliances. Dwelling on rent Wood products & paper Energy intensity Energy uses in service sector Energy intensity is calculated for different fuel types: Motor fuels, electricity & thermal fuels for industrial sector. Energy uses in service sector are for space heating , Cooling, and other end -uses for motor fuels, Electricity, and other thermal uses. Brick & cement Others 5 05/01/2015
SEI Demand Modeling Methodologies (1) Final Energy Analysis: e = a i Where e=energy demand, a=activity level, i=final energy intensity (energy consumed per unit of activity) Example: energy demand in the cement industry can be projected based on tons of cement produced and energy used per ton. Each can change in the future. Useful Energy Analysis: e = a (u / n) Where u=useful energy intensity, n = efficiency Example: energy demand in buildings will change in future as (1) more buildings are constructed [+a] (2) people get richer and heat and cool buildings more [+u], or building insulation improves [-u], or as people switch from less efficient oil boilers to electricity or natural gas [+n]. 1. 2.
SEI Demand Modeling Methodologies (2) Stock Analysis: e = s d Where s=stock, d=device intensity (energy use per device). Stock is modeled endogenously based on existing vintage of devices, sales of new devices and survival profile for devices. Example: how quickly will a new energy efficiency standard for refrigerators lead to energy savings based on penetration of new devices and turnover of existing stock? Transport Analysis: e = s m / fe Where m = vehicle miles, fe = fuel economy (MPG) Allows modeling of vehicle stock turnover. Also allows pollutant emissions to be modeled as function of vehicle miles Example: model impact of new vehicle fuel economy (CAF ) or emissions standards. 3. 4.
Residential sector El = Nl. Pl . Ml . Il., where N total number of households P penetration of end-use device (TV/hh) M-frequency of energy use (hrs/day) I - specific energy consumption (SEC) El -energy consumption as per end use activity, l 3/12/2025 8
Industrial sector To evaluate industrial energy demand, the various types of industries should be identified. As per the Nepal Standard Industrial Classification (NISC), 20 categories are classified such as food manufacturing, beverage industry, tobacco industry, chemical industry and etc. El = SUM(Eli), where l cottage, medium, or large i type of industry 3/12/2025 9
Industrial sector Ei = SUM(Nij. Mij . Iij . ), where Nij the number of industries of type i having end use j Mij the number of products of type i having end use j Iij the specific energy consumption of type i having end use j 3/12/2025 10
Commercial sector In Nepal, commercial sector includes hotels, restaurants, hospitals, education buildings, shops, public, and private offices. Ec = SUM(Eci), where for I type of commercial institution Eci = SUM(Aij. Pij . Mij . Iij . ), where Aij the total floor area for the end use j Pij penetration of Aij having end use j Mij frequency of energy use at institution i having end use Iij SEC per given unit of Mij 3/12/2025 11
Transport sector In Nepal, there are two major modes of transportation land and aviation. Ei = SUM(Nij. Mij . Iij . ), where Ei energy consumed by each type of transport i Nij the number of transport of type i having end use j Mij the vehicle- Km or ton-km Iij the specific energy consumption litre per vehicle-km 3/12/2025 12
SUPPLY SYSTEMS Nepal does not have the known resources of petroleum products till yet There are sporadic reserves of coal in Western parts of Nepal but extraction of it is not yet commercialized yet Supply of energy is mostly met from hydropower resources, imports of petroleum products, coal and non- hydro renewable energy such as solar, biogas etc. The main supply of solid biomass is fuelwood from forest resources, agriculture residue and animal dung
HYDROPOWER RESOURCES 500 kW hydropower plant was constructed at Pharping in 1911 Among all secondary commercial energy sources electricity is the major one. In case of Nepal, hydro- electricity is the only commercial source that is indigenously produced. The potential of hydropower resources as per Tester et al. (2009) can be represented by ?????(?) = 9.81 103??? Where, Z = net height of the water head m Q = volumetric water flow in m3/s e =efficiency of the conversion process (0.8 to 0.9)
POTENTIAL OF HYDROPOWER RESOURCES Potential in MW Number of Project River Basin Economic Potential Capacity in MW Sites Small river courses Total Potential in Major river courses River Basin having catchments SaptaKoshi 40 10,860 MW having catchments areas 300-1000 areas above 1000 km2 SaptaGandaki 12 5,270 km2 Karnali 7 24,000 SaptaKoshi 18,750 3,600 22,350 Mahakali 2 1,125 SaptaGandaki 17,950 2,700 20,650 Karnali Mahakali and 32,680 3,500 36,180 Southern Rivers 5 878 Southern Rivers 3,070 1040 4,110 Country Total 66 42,133 Country Total 72,450 10,840 83,290 (Shrestha, 1965; WECS, 2010)
SOLAR ENERGY REOSURCES Nepal, being located in favourable latitude, receives ample solar radiation The average solar radiation varies from 3.6 6.2 kWh/m2/day, and the sun shines for about 300 days a year The potential solar PV power can be calculated by simple equation ???????= ????????103/24(???/??2 Where, Powerpv = Power from array of photovoltaic panels in MWp/km2 ef = conversion factor of the photovoltaic panel into electricity (from 0.1 to 0.2) Isolar = global solar insolation (kWh/m2/day)
OBJECTIVE OF ENERGY PLAN The ultimate aim of the energy plan is to arrive at a set of agreed, feasible and consistent targets for energy policy, or at an energy plan . The energy policy analysis contains two aspects An information assembly and coordination stage A forum for assessing energy management tools 18
ASPECTS OF ENERGY POLICY The first aspect places earlier assessments and projections mainly demand scenarios and supply options, in a coherent economy-wide framework. This will be done in energy-supply balancing. In this stage, the impacts of energy policy upon economy at large will be discussed. Similarly, investment programs and methods of incorporating environmental dimensions at the supply system level will also be discussed. 19
ASPECTS OF ENERGY POLICY The second aspect covers the policy tools available for closing energy supply demand gaps and for overcoming imbalances between the energy sector and the economy as a whole. These are labeled energy management tools and relate to various demand side and supply side options. Both these two aspects are complementary of policy analysis in the integrated energy planning. 20
SIMULATION FRAME WORK FOR ENERGY SUPPLY DEMAND BALANCE The demand scenarios and supply options, though devised with a view of the overall energy system of a country, do not match at a first go. This matching is done through interactive process, i.e. simulation, through the following three components. 21
SIMULATION FRAME WORK FOR ENERGY SUPPLY DEMAND BALANCE An energy supply - demand balance network An energy economy interaction mechanism, and A checking for system constraints, such investments capacity and environmental requirements. 22
SUPPLY DEMAND BALANCING NETWORK Its purpose is to iteratively match energy supply to energy demand. Especially softwares LEAP, MARKAL will be helpful in observing various scenarios. Such network permits a formal evaluation of fuel-mix and inter-fuel substitution, and more generally, of fuel and technology strategies. Export and import positions for the country in energy products could be looked into. 23
SIMULATION FRAME WORK FOR ENERGY SUPPLY DEMAND BALANCE The aim of the energy-economy interaction mechanism is to capture in economic terms the consequences of alternative supply system configuration for the country. The focus is on impact analysis. What will be effects of specific energy strategies on major economic variables such as national income (GDP), wages and interest rates, and the balance of payments? What will be impact on industrial growth rate? 24
SIMULATION FRAME WORK FOR ENERGY SUPPLY DEMAND BALANCE System constraints in terms of investment requirements and environmental considerations have to be looked into the simulation framework. The emphasis is on setting investment priorities and identifying sets of projects. Energy environmental impact assessments assist the formulation of energy-environmental scenarios and influence the investment decisions. 25
ENERGY SUPPLY DEMAND MANAGEMENT TOOLS The objective of the second aspect of policy analysis is to identify and assess policy parameters in energy management. For the supply and demand sides, these must be set against declared energy policy targets of the country such as cost minimization, the degree rural electrification attempted, alternative energy program implemented, and reduction of import bills and other targets. 26
ENERGY SUPPLY DEMAND MANAGEMENT TOOLS The measures to achieve the energy policy analysis goals are: Pricing policy Non price measures, and Energy conservation efforts. 27
SUPPLY SIDE MANAGEMENT On the supply side, management is mostly concerned with energy investment decisions and at a project level. The theoretical notion for arriving at correct prices is that of shadow prices. Non price measures include rate of return incentive schemes. Energy conservation efforts start at the supply system design and implementation such as maximizing the use of oil substitutes. 28
DEMAND SIDE MANAGEMENT On the demand side, pricing measures mainly include the application of long range marginal cost (LRMC) policy. Non-price measure comprises differential schedules (by time of day, user category and the like) and outright rationing in many forms (load-shedding, even number even day petrol allocation and the like). Energy conservation efforts include activities such as increases in efficiency of energy-using devices, change of different technology, implementation of energy audit system etc. 29