Engaging Families and Communities for School Improvement
40 Years of research emphasizes the crucial role of family engagement in a child's academic success. This deep dive into parent and community engagement explores challenges, opportunities, and strategies for effective school improvement under the ESSA framework. Topics include ESSA accountability, identifying low-performing schools, and comprehensive support and improvement initiatives. Learn how states allocate Title I funding, engage stakeholders, and implement evidence-based interventions to enhance school outcomes.

Download Presentation

Please find below an Image/Link to download the presentation.
The content on the website is provided AS IS for your information and personal use only. It may not be sold, licensed, or shared on other websites without obtaining consent from the author.If you encounter any issues during the download, it is possible that the publisher has removed the file from their server.
You are allowed to download the files provided on this website for personal or commercial use, subject to the condition that they are used lawfully. All files are the property of their respective owners.
The content on the website is provided AS IS for your information and personal use only. It may not be sold, licensed, or shared on other websites without obtaining consent from the author.
E N D
Presentation Transcript
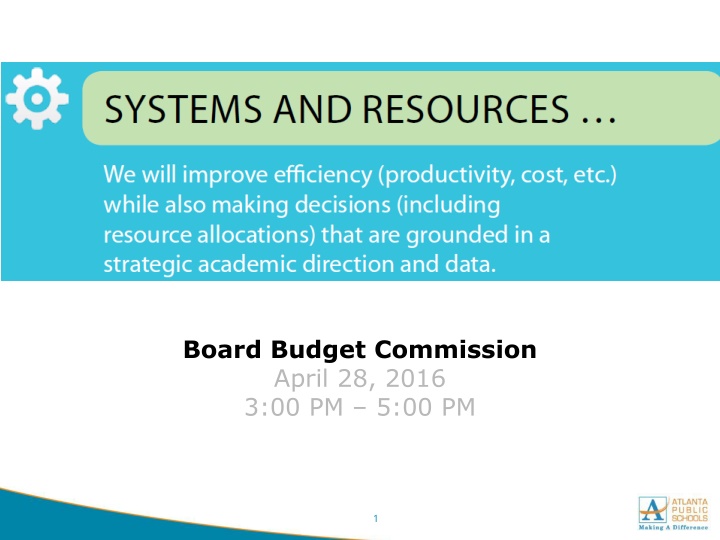
Board Budget Commission April 28, 2016 3:00 PM 5:00 PM 1
Agenda Meeting Goals - 5 minutes FY2017 Tentative Budgets - Special Revenue Budgets - Capital Projects, School Nutrition, Debt Service, and Student Activity Funds 30 minutes Continued Big Bets Discussion - 45 minutes Wrap up 2
Goals For this meeting -To reach alignment on the FY2017 budget for: Special Revenue (Title I, Title II, Title VI-B, etc.) Capital Projects, School Nutrition, Debt Service, and Student Activity Funds -To further prioritize Big Bet Ideas -To establish the calendar for the millage rate process -To discuss the current progress towards developing a multi-year financial plan Going forward -Continue developing a comprehensive multi-year plan that balances revenue against expenditures -Continue considering the long-term implications for revenue streams -Continue identifying the long-term approach for strategic priorities and other large expenditure items -Continue identifying decision-packages to allow for transparent and clear priorities for new revenue 4
Summary of Special Revenue Special Revenue Funds are used to account for the proceeds of specific revenues that are legally restricted or committed for specific purposes. The School System s Special Revenue Funds have been established primarily on the basis of program purpose and are broken out into three major categories: Federal Title, Direct Federal, and State and Other Special Revenue programs. $70.1 million Some of the major and primary projected funding sources for fiscal year 2017 are: Title I-A Improving the Academic Achievement: Provide remedial education in the areas of reading and mathematics $26.0 million Title II: Improving teacher quality and increasing the number of highly quality teachers, Para-professionals and principals $4.9 million Title VI-B: Provide special education programs for children in PreK-12th grade $9.5 million 6
FY17 Special Revenue Summary FY16 Amended Budget as of 3.30.16 FY17 Projected Allocation Fund Fund Description Function % Change 402 Title I FEDERAL GRANT ADMINISTRATION GENERAL ADMINISTRATION IMPROVEMENT OF INSTRUCTIONAL SERVICES INSTRUCTION OTHER SUPPORT SERVICES PUPIL SERVICES SCHOOL ADMINISTRATION STUDENT TRANSPORTATION SERVICE 3,107,076 2,684,298 18,784,026 20,050,262 3,685,584 548,788 10,178 899,042 49,769,253 89,053 334,929 118,359 6,135,730 1,992,817 1,229,155 9,900,043 8,448 83,250 473,532 565,230 351,408 72,773 8,964,661 70,000 7,867 475,791 9,942,499 793,972 793,972 2,392,732 2,067,155 14,465,418 15,440,535 2,838,237 422,617 7,838 692,344 38,326,876 85,696 322,305 113,898 5,904,468 1,917,706 1,182,827 9,526,900 8,736 86,088 489,676 584,500 243,844 50,498 6,220,632 48,573 5,459 330,154 6,899,160 402 Total 404 Title I Title VI-B Special Education -23% FEDERAL GRANT ADMINISTRATION GENERAL ADMINISTRATION IMPROVEMENT OF INSTRUCTIONAL SERVICES INSTRUCTION PUPIL SERVICES STUDENT TRANSPORTATION SERVICE 404 Total 406 Title VI-B Special Education Vocational Ed -4% FEDERAL GRANT ADMINISTRATION IMPROVEMENT OF INSTRUCTIONAL SERVICES INSTRUCTION 406 Total 414 Vocational Ed Title II 3% FEDERAL GRANT ADMINISTRATION GENERAL ADMINISTRATION IMPROVEMENT OF INSTRUCTIONAL SERVICES INSTRUCTION OTHER SUPPORT SERVICES SUPPORT SERVICES - CENTRAL 414 Total 430 430 Total Title II Charter Schools-Federal Charter Schools-Federal -31% INSTRUCTION 0 0 -100% FY17 allocations include FY16 remaining balances but not inclusive of possible carryover funds 7
FY17 Special Revenue Summary FY16 Amended Budget as of 3.30.16 FY17 Projected Allocation Fund Fund Description Function % Change 432 Education of Homeless Children FEDERAL GRANT ADMINISTRATION GENERAL ADMINISTRATION INSTRUCTION PUPIL SERVICES STUDENT TRANSPORTATION SERVICE 4,882 193 17,479 12,835 46,094 81,482 50,000 69,250 119,250 267,302 229,237 79,680 576,219 125,424 50,297 32,975 1,073,941 40,185 167,151 81,960 1,571,933 775,561 775,561 364,616 364,616 18,400 686,729 6,110 242 21,876 16,064 57,692 101,984 103,669 143,581 247,250 183,321 157,215 54,646 395,182 86,333 34,621 22,697 739,220 27,660 115,054 56,415 1,082,000 800,000 800,000 320,000 320,000 18,143 677,150 432 Total 448 Education of Homeless Children Crest Education 25% IMPROVEMENT OF INSTRUCTIONAL SERVICES INSTRUCTION 448 Total 460 Crest Education Title III Limited English 107% IMPROVEMENT OF INSTRUCTIONAL SERVICES INSTRUCTION OTHER SUPPORT SERVICES 460 Total 462 Title III Limited English Title IV- 21st Century -31% FEDERAL GRANT ADMINISTRATION GENERAL ADMINISTRATION IMPROVEMENT OF INSTRUCTIONAL SERVICES INSTRUCTION OTHER SUPPORT SERVICES PUPIL SERVICES STUDENT TRANSPORTATION SERVICE 462 Total 478 478 Total 501 501 Total 510 Title IV- 21st Century Fresh Fruit and Vegetable Fresh Fruit and Vegetable Athletics Athletics Adult Education -31% SCHOOL NUTRITION PROGRAM 3% PUPIL SERVICES -12% IMPROVEMENT OF INSTRUCTIONAL SERVICES INSTRUCTION MAINTENANCE AND OPERATION OF PLANT SERVICES OTHER SUPPORT SERVICES 12,398 154,639 872,166 12,225 152,482 860,000 510 Total Adult Education -1% FY17 allocations include FY16 remaining balances but not inclusive of possible carryover funds 8
FY17 Special Revenue Summary FY16 Amended Budget as of 3.30.16 Fund Fund Description Function FY17 Projected Allocation 768,027 145,926 52,865 2,000 968,819 14,002 3,130,214 7,940 3,152,156 1,917 365,155 44,579 501,287 5,500 43,416 961,854 % Change 514 HeadStart IMPROVEMENT OF INSTRUCTIONAL SERVICES INSTRUCTION PUPIL SERVICES STUDENT TRANSPORTATION SERVICE 554,922 105,436 38,197 1,445 700,000 13,081 2,924,304 7,418 2,944,802 1,049 199,831 24,396 274,330 3,010 23,759 526,375 514 Total 560 HeadStart Pre-K Lottery -28% IMPROVEMENT OF INSTRUCTIONAL SERVICES INSTRUCTION STUDENT TRANSPORTATION SERVICE 560 Total 580 Pre-K Lottery Private Grant Funding -7% IMPROVEMENT OF INSTRUCTIONAL SERVICES INSTRUCTION PUPIL SERVICES STUDENT TRANSPORTATION SERVICE SUPPORT SERVICES - BUSINESS SUPPORT SERVICES - CENTRAL 580 Total Private Grant Funding -45% 582 Trust and Foundations FACILITIES ACQUISITION AND CONSTRUCTION SERVICES GENERAL ADMINISTRATION IMPROVEMENT OF INSTRUCTIONAL SERVICES INSTRUCTION 100,000 61,276 1,083,524 98,118 138,337 84,768 1,498,920 135,733 MAINTENANCE AND OPERATION OF PLANT SERVICES PUPIL SERVICES SCHOOL ADMINISTRATION STUDENT TRANSPORTATION SERVICE 32 44 520,322 1,816 15,336 1,880,423 2,000 83,423 35,716 121,139 35,000 324,339 654,764 1,014,103 719,800 2,512 21,215 2,601,329 582 Total 583 Trust and Foundations University and Colleges 38% GENERAL ADMINISTRATION IMPROVEMENT OF INSTRUCTIONAL SERVICES INSTRUCTION 638 26,616 11,395 38,649 363,637 172,707 348,656 885,000 583 Total 585 University and Colleges Local Government Grants -68% IMPROVEMENT OF INSTRUCTIONAL SERVICES INSTRUCTION PUPIL SERVICES 585 Total Local Government Grants -13% FY17 allocations include FY16 remaining balances but not inclusive of possible carryover funds 9
FY17 Special Revenue Summary FY16 Amended Budget as of 3.30.16 FY17 Projected Allocation Fund Fund Description Function % Change 586 District Priorities GENERAL ADMINISTRATION 123,500 67,967 IMPROVEMENT OF INSTRUCTIONAL SERVICES 102,738 56,541 INSTRUCTION 262,768 144,612 MAINTENANCE AND OPERATION OF PLANT SERVICES 50,000 27,517 SUPPORT SERVICES - BUSINESS 419,212 230,710 SUPPORT SERVICES - CENTRAL 11,000 6,054 586 Total District Priorities 969,218 533,400 -45% 587 AETC EDUCATIONAL MEDIA SERVICES 85,221 92,848 SUPPORT SERVICES - CENTRAL 112,131 122,167 587 Total AETC 197,352 215,015 9% 589 Governmental Funds_Other FACILITIES ACQUISITION AND CONSTRUCTION SERVICES 127,079 107,335 GENERAL ADMINISTRATION 120,453 101,739 IMPROVEMENT OF INSTRUCTIONAL SERVICES 2,547 2,151 INSTRUCTION 92,435 78,074 MAINTENANCE AND OPERATION OF PLANT SERVICES 0 0 PUPIL SERVICES 500,000 422,318 SCHOOL ADMINISTRATION 1,853,890 1,565,861 STUDENT TRANSPORTATION SERVICE 274,350 231,726 589 Total Governmental Funds_Other 2,970,754 2,509,204 -16% Grand Total 86,652,931 70,097,626 -19% FY17 allocations include FY16 remaining balances but not inclusive of possible carryover funds 10
Title I-A Improving the Academic Achievement Title I, Part A (Title I) of the Elementary and Secondary Education Act, as amended (ESEA) provides financial assistance to local educational agencies (LEAs) and schools with high numbers or high percentages of children from low-income families to help ensure that all children meet challenging state academic standards. APS currently has 84 schools operating under Title I programming. For FY 17, APS will distribute Title I funds using rank order and grade span grouping. Schools will be grouped as either High, Middle, or Elementary. After the groups are created, the schools are listed in rank order by percent of poverty and distributed an allocation. Title I-A Improving the Academic Achievement 5 Year Allocation Trend 70,000,000 59,850,401 60,000,000 56,173,903 48,799,411 50,000,000 40,000,000 33,430,839 30,000,000 26,000,000 20,000,000 10,000,000 - FY2013 Award FY2014 Award FY2015 Award FY2016 Award Projected FY2017 Award 2013-2016 Awards include carryover from prior year 11
Title II-A Improving Teacher Quality Title II is a federal grant that provides technical assistance, resources and program monitoring of school districts to ensure all teachers and paraprofessionals in GA meet state and federal highly qualified requirements. All school districts must have equitable distribution of highly experienced, highly qualified, and highly effective teacher and leaders. Looking Ahead: The FY17 projections are about the same as FY16 ($4,899,160). The Comprehensive Needs Assessment guides the use of Title IIA federal funds. Components of funding supports district s prioritized needs within the following areas: Professional learning (student support and interventions, teacher development, leader development, professional growth) Personnel (recruitment, retention, effectiveness) Title II-A Administration (prioritizing funds, needs assessment/consultation, internal controls) Title II-A Improving Teacher Quality 5 Year Allocation Trend 8,000,000 6,826,944 6,432,189 7,000,000 5,673,992 6,000,000 5,032,793 4,899,160 5,000,000 4,000,000 3,000,000 2,000,000 1,000,000 - FY2013 Award FY2014 Award FY2015 Award FY2016 Award Projected FY2017 Award 2013-2016 Awards include carryover from prior year 12
Title VI-B IDEA Special Ed Title VI-B of the Individuals with Disabilities Education Act is a federal program that provides funding for districts to supplement the level of special education and relation services to students with disabilities. It covers ages 3-21. The Federal Preschool budget supports the Special Education Preschool department in the following areas: daily operations, preschool staff, maintenance repairs for audio logical equipment and instructional materials for preschool students. The Federal Preschool Disproportionality funds support: Salaries for Engagement Specialists, office materials/supplies and social emotional learning assessments for identified students. Looking ahead: The majority of the Title VI-B funds are used for personnel cost and there will not be any changes to the current positions. However, in FY16 the state provided funding for one year to support the Student Success Imagine the Possibilities Initiative. APS opened our first Grady Health Transition class in January 2016. This program prepares students with disabilities for work. Students have teacher and paraprofessional support for jobs on site at Grady. The supportive employment agency (Briggs and Associates) follows these students throughout their adult careers. One of our students is going to be offered employment this April at Grady. In FY17, the Office of Exceptional Children would like to open another class and will be budgeting a teacher and paraprofessional using VI-B funds. Title VI-B Preschool 5 Year Allocation Trend Title VI-B 5 Year Allocation Trend 359,444 359,131 400,000 15,000,000 12,970,145 11,801,314 344,402 326,900 324,434 9,547,271 9,477,614 300,000 9,200,000 10,000,000 200,000 5,000,000 100,000 - - FY2013 Award FY2014 Award FY2015 Award FY2013 Award FY2014 Award FY2015 Award FY2016 Award Projected FY2017 Award FY2016 Award Projected FY2017 Award 2013-2016 Awards include carryover from prior year 13
Capital Projects, SPLOST, School Nutrition, Debt Service, and Student Activity Funds 14
Summary of Funds This section provides an overview of additional budgeted funds for the upcoming year. These include Capital Projects, School Nutrition, Debt Service and Student Activity Funds to total $194,439,929 Capital Projects (Fund 300) - funds are used to account for financial resources to be used for the acquisition or construction of major capital facilities (other than those financed by proprietary funds and trust funds). Capital projects is administered by the district s Facilities Capital Improvement and Construction Management Department . Responsibilities include the acquisition of school sites, the design and construction of new school facilities (including additions to existing schools), renovations of existing school facilities, and installation and relocation of temporary classroom facilities to house students and instructional programs and services at schools with insufficient permanent space. $2.3 million SPLOST (Fund 354)- A special-purpose local-option sales tax (SPLOST) is a financing method for funding capital outlay projects in the U.S. state of Georgia. It is an optional 1% sales tax levied by any county for the purpose of funding the building of parks, schools, roads, and other public facilities. $154.0 million School Nutrition (Fund 600) - (The National School Lunch Program) is a federally assisted meal program operating in over 100,000 public and non profit private schools and residential child care institutions. The Food and Nutrition Service administers the program at the Federal level. At the State level, the National School Lunch Program is usually administered by State education agencies, which operate the program through agreements with school food authorities. $32.0 million Debt Services (Fund 200) - Used to finance and account for payment of principal and interest on all long-term general obligation debts. Debt service funds are used to accumulate resources over the outstanding life of the bond issue in an amount equal to the maturity value. Cash of the debt service may be invested in income producing securities that are converted back into cash at the maturity date for use in retiring bonds. $500,000 Student Activity Funds - Activity funds are established to direct and account for monies used to support co-curricular and extracurricular student activities. As a general rule, co-curricular activities are any kinds of school-related activities outside the regular classroom that directly add value to the formal or stated curriculum. Two classifications are commonly recognized: student activity funds, which belong to the students and are used to support student organizations and clubs; and district activity funds, which belong to the school district and are used to support district programs $5.5 million 15
Summary of Funds FY16 Amended Budget as of 3.30.16 FY17 Projected Allocation Fund Function % Change 200 DEBT SERVICE 2,006,359 500,000 200 Total 2,006,359 500,000 -75% FACILITIES ACQUISITION AND CONSTRUCTION SERVICES 300 326,470 196,924 GENERAL ADMINISTRATION MAINTENANCE AND OPERATION OF PLANT SERVICES 175,378 105,787 818,774 493,878 STUDENT TRANSPORTATION SERVICE 60,505 36,496 SUPPORT SERVICES - CENTRAL 2,475,491 1,493,196 300 Total 3,856,618 2,326,280 -40% 354 DEBT SERVICE FACILITIES ACQUISITION AND CONSTRUCTION SERVICES MAINTENANCE AND OPERATION OF PLANT SERVICES 3,683,000 4,012,554 128,881,023 140,413,266 5,916,644 6,446,064 STUDENT TRANSPORTATION SERVICE 2,871,202 3,128,116 354 Total 141,351,869 154,000,000 9% 600 Nutrition 33,339,140 32,113,649 600 Total Grand Total 33,339,140 180,553,986 32,113,649 188,939,929 -4% 5% This grand total does not include School Activity Funds 16
SPLOST The FY17 SPLOST budget supports the district s ongoing efforts to enhance educational opportunities for our students. SPLOST provides the resources to upgrade school campuses through addition and renovation construction projects, complete major building systems and component replacements, including critical HVAC replacements, provides for safety and security enhancements, upgrades to athletic fields and playgrounds, upgrades to technology infrastructure and equipment, the replacement of school buses, and to retire COPS debt service. FY17 will be the final year of SPLOST IV and we will be monitoring incoming revenues carefully to make sure we finish the SPLOST IV program in accordance with completed and planned projects. $154.0 million SPLOST FY16 vs. FY17 180,000,000 154,000,000 160,000,000 141,351,869 140,000,000 120,000,000 100,000,000 80,000,000 60,000,000 40,000,000 20,000,000 - FY16 Budget Projected 2017 Budget 17
Nutrition The Atlanta Board of Education promotes student success and healthy schools by supporting wellness, good nutrition, and regular physical activity as a part of the total learning environment. The National School Lunch program is a federally assisted meal program that provides well balanced, low-cost or free lunches to children each school day. Atlanta Public Schools also participates in the Fresh Fruit and Vegetable Program. This program is successful in that it introduces school children to a variety of produce that they otherwise might not have the opportunity to sample. Looking Ahead: National School Lunch Program o Reduction of $0.25M for Workers Compensation o Reduction of $1.0M of contractual authority with Sodexo o Increase of $1.0M in order to replace cafeteria equipment at Kimberly and Boyd that can t be covered by SPLOST 2012 o Increase of $0.5M to cover District Indirect Cost (at 3.52%) Fresh Fruit and Vegetable Program o Increasing the Fresh Fruit and Vegetable award by 4 schools totaling an estimated $0.8M Nutrition FY16 vs. FY17 32,113,649 35,000,000 31,129,992 30,000,000 25,000,000 20,000,000 15,000,000 10,000,000 5,000,000 - FY2016 Budget Projected FY2017 Budget 18
Debt Service Fund The City of Atlanta has issued various general obligation bonds and general obligation refunding bonds on behalf of the Atlanta Independent School System. The debt service for these bonds has been funded through the school system s bonded debt portion of the annual tax levy. The bonded debt portion of property taxes collected by the City of Atlanta on behalf of Atlanta Independent School System is retained by the City and used to pay the annual debt service on outstanding bonds. In consultation with our financial advisor, APS is working with the City to validate the remaining balance. As of now and dependent on validation, the following recommendations are made for FY17. Going forward in FY17, APS is celebrating the conclusion to paying off its long-term debt and becoming long-term debt-free. $500,000 Millage Rate -The FY16 millage was set at 0.1 mills -For FY2017 there are two options: Set the proposed millage rate to 0.025 mills Pay the remaining long-term debt out of fund balance The recommendation is to redirect the 0.1 mills to the general fund. This will represent a tax rate neutral impact to citizens. Debt Service FY16 vs. FY17 2,500,000 2,006,359 2,000,000 1,500,000 1,000,000 500,000 500,000 - FY16 Budget Projected 2017 Budget 19
School Activity Funds School Activity Funds are bank accounts at individual schools under the control of school principals or club advisors. These funds are a combination of sums of money, that flow through in the form of school board funds, student-generated funds, receipts and disbursements related to athletics, and the myriad co- curricular and extracurricular events sponsored by school districts. $5.5 million -School Activity Accounts are required to be reported within the District s financial statements. -FY17 projected appropriations are provided for Board approval Student Activity Funds FY16 vs. FY17 5,500,000 6,000,000 5,221,347 5,000,000 4,000,000 3,000,000 2,000,000 1,000,000 - FY16 Budget Projected 2017 Budget 20
Big Bet Ideas: Priority Big Ideas to Solve Longstanding APS Challenges Expected Cost Atlanta Leadership Development Program (ALDP) will focus on developing leadership at all levels of APS with a focus on 1) building a pipeline of leaders to fill critical principal vacancies through a rigorous 2.5 year residency program; 2) using proven adult learning strategies to develop principals leadership skills, and 3) building the local capacity to sustain and replicate the program. ALDP will aim to place leaders in the highest need APS schools. Talent $2.0 million Development While early childhood for pre-K is addressed in our base-budget, with additional funds we could do much more to support and strengthen our programs and expand our impact to serve younger students (ages 0- 4) through new early childhood centers. Scenario 1= $25.8 million Scenario 2= $X* Scenario 3= $X* Scenario 4= $X* Early Childhood* *Additional details provided as soon as possible 22
Big Bet Ideas: Priority Big Ideas to Solve Longstanding APS Challenges Get APS Reading by 2nd/3rd Grade- The turnaround strategy will budget for a math specialist and reading specialist at 15 elementary schools in the targeted support tier. Get APS Reading would provide sufficient funding to ensure that elementary schools in the pilot cluster are able to have a reading specialist to deliver direct services to students. Family Engagement- This strategy would commit additional resources to the development of a more comprehensive and integrated parental engagement approach that will result in empowering and equipping parents and caregivers to become more informed advocates for children. Wrap-Around Services- Leveraging the research around community schools , the District would invest in a comprehensive set of integrated services designed to better meet students needs (e.g. in-school services such as childcare and or health clinics; extended learning hours; robust after-school programs; and programs for parents such as GED pathways, job training support, or mental health services). Cost $6.0 million $2.5 million End Intergenerational Poverty: District-wide Broad Approach $28.0 million Total - $36.5 million End Intergenerational Poverty: Deep Intervention Approach in One Cluster Pilot program in one cluster that will provide job training and adult education, financial literacy, housing assistance, health clinics, enhanced nursing services, additional social worker support, after-school programming, partnership support, and an early childhood center. $17.3 million 23
Talent Development Total Estimated Cost = $2.0 million 24
Early Childhood Scenario 1: Early Learning Centers -Goal: To build state-of-the-art, year-round, full-day, full-service early learning centers that address students physical, social/emotional, and cognitive development from birth to age five via the delivery of high- quality learning experiences and customized wraparound supports. A center would serve approximately 300 students, plus house a community health center, and a parent resource center. Scenario 1 Curriculum, Instruction, and Assessment $ 1,274,000 Wraparound Services $ 2,125,000 Infrastructure $ 5,049,128 Renovations and Building Operations $ 17,322,500 Initiative Total $ 25,770,628 25
Early Childhood Scenario 2*: Underserved Four-Year Old Children in Atlanta -Goal: Pre-kindergarten expansion willprovide opportunities for the underserved population of four-year olds in the city of Atlanta. APS and community providers currently serve approximately 60% of four-year olds in the Atlanta area, leaving 40% of children unserved. Expanding pre-kindergarten to serve these students will allow us to reach an additional 1,920 students. A comprehensive program steeped in language-rich experiences will support the needs of the children and position them for a successful transition to kindergarten. Additionally, students who live in their school attendance zones will receive transportation. Educating all four-year olds will serve as a great start that will increase student achievement and ultimately prepare them for college and career. Scenario 3*: Professional Learning for Non-APS Teachers -Goal: Atlanta Public Schools will provide targeted, ongoing professional learning opportunities to 120 Georgia pre-kindergarten teachers who are not in the APS system. This will allow the district along with the community-based partners to build a culture of collaboration and a community of practice that will not only enhance the capacity building of individuals but the city at large. This will result in the deepening of teachers content knowledge, expanding their instructional practices, and enhancing their ability to cultivate and foster a student-centered environment. Scenario 4*: Early Learning PreK- 3rd Grade -Goal: Atlanta Public Schools goal is to build a coherent program connecting pre- kindergarten to third grade that promotes smoother transitions for children and families, and improves student achievement. This program will ensure pre- kindergarten through third grade children receive language-rich learning experiences that support their full range of development and equip them with the skills needed to build literacy, numeracy, social-emotional learning and other competencies needed for school success. *Additional details provided as soon as possible 26
End Intergenerational Poverty: District-wide Broad Approach Get APS Reading by 2nd/3rd Grade- $6.0 million Two reading specialist @ 31 remaining schools = $5.27 million Professional Development = $230,000 Curricular Resources = $500,000 Family Engagement- $2.5 million To provide funding for the launch of a parenting center in every cluster (like PAPAC) and funding for a new Office of Family Engagement that would include the roll-out of an integrated family-engagement strategy, providing support for GO-Teams implementation, school/cluster communication support, and parent education initiatives. Wrap-Around Services- $28 million To provide $400,000 per school (estimated from Chicago Public Schools) to implement one or two components of the community school concept or cluster-wide funding to create one comprehensive community school per cluster. Total Estimated Cost = $36.5 million 27
End Intergenerational Poverty: Deep Intervention Approach in One Cluster Cluster Level Comprehensive Strategy Job Training & Adult Education Financial Literacy Housing Assistance Health Clinic Annual cost of district's adult education program $100K per school $100K per school A clinic for the cluster $850,000 $900,000 $900,000 $2,000,000 Enhanced Nursing Services $765,000 A nurse for each school Social Work Support $765,000 Additional social worker per school After School Programming $2,160,000 Salaries and supplies Funding for mentoring &/or wrap-around partnerships Annual operating costs of full service center for 300 students (does not account for possible federal/state funds) Partner Support $2,250,000 Early Childhood Center $6,700,000 TOTAL $17,290,000 28
Wrap-Up 29
Budget Calendar (1 of 3) Atlanta Public Schools Fiscal Year 2017 General Fund Budget Development Calendar 9/4/2015 Item # v10 Item Description Board/Superintendent workshop - Initial Academic and Operating Goals and Priorities for Budget Parameters Senior Executive Leadership Team review of the Fiscal Year 2017 budget planning framework and timeline Budget parameters identified and finalized by Senior Executive Leadership Team Dates 1 August 27, 2015 2 September 1, 2015 3 September 1, 2015 4 Fiscal Year 2017 Budget Planning Parameters and Timeline presented and approved by the Board September 8, 2015 5 6 Expanded Cabinet discusses budget framework, parameters and timeline Senior executive leadership team discussion of the budget September 17, 2015 October 27, 2015 7 Board reviews/discusses Fiscal Year 2017 budget assumptions, staffing formulas and strategic priorities November 2, 2015 8 9 Departments receive Fiscal Year 2017 Budget templates Board Budget Commission Meeting to Discuss Multi-year Budgeting Strategy Budget and Finance Advisory Committee, initial meeting (CFO only) Expanded Cabinet discusses budget approach, options and provides feedback November 11, 2015 November 12, 2015 November 12, 2015 November 19, 2015 10 11 12 Board approves Fiscal Year 2017 budget assumptions, staffing formulas and strategic priorities December 14, 2015 13 14 15 16 17 18 19 Budget and Finance Advisory Committee, second meeting Fiscal Year 2015 Mid-Year adjustment Departments submit completed budgets Governor's State of the State Address and Education Budget (OMB) Board Budget Commission Meeting to Discuss Multi-year Budgeting Strategy Budget and Finance Advisory Committee, third meeting Budget Office compiles budget December 17, 2015 January 11, 2016 January 14, 2016 January 14, 2016 January 21, 2016 January 21, 2016 January 29, 2016 30
Budget Calendar (2 of 3) 20 21 Senior Executive Leadership Team budget retreat to complete preliminary budget proposal Budget and Finance Advisory Committee, fourth meeting Superintendent presents the Fiscal Year 2017 Budget Primer to the Board Budget Commission meeting (at call of Committee chair) Board Budget Commission meeting (at call of Committee chair) FC Tax Commissioner and FC Chief Assessor Board Presentation Superintendent presents the Fiscal Year 2017 Budget Primer to the Board Conduct regional public meeting for Fiscal Year 2017 General Fund Budget Conduct regional public meeting for Fiscal Year 2017 General Fund Budget Board Budget Commission meeting (at call of Committee chair) Conduct regional public meeting for Fiscal Year 2017 General Fund Budget Conduct regional public meeting for Fiscal Year 2017 General Fund Budget February 2, 2016 February 18, 2016 22 February 18, 2016 23 24 25 26 27 28 29 30 February 29, 2016 February 29, 2016 March 7, 2016 March 10, 2016 March 17, 2016 March 17, 2016 March 24, 2016 March 31, 2016 31 Board Budget Commission meeting (at call of Committee chair) April 15, 2016 32 Budget and Finance Advisory Committee, fifth meeting April 19, 2016 33 Public budget hearing for Fiscal Year 2017 General Fund Budget April 20, 2016 34 Superintendent presents the Fiscal Year 2017 Budget to the Board (Tentative adoption) April 20, 2016 35 First read of the tax Millage rates for Fiscal Year 2017 April 20, 2016 36 37 38 39 Board Budget Commission meeting (at call of Committee chair) Salary Hearing #1 (If necessary) Tax assessor provides preliminary appraisal values to District Salary Hearing #2 (If necessary) April 28, 2016 May 5, 2016 May 6, 2016 May 12, 2016 31
Budget Calendar (3 of 3) 40 Board Budget Commission meeting (at call of Committee chair) May 18, 2016 41 Superintendent presents the Fiscal Year 2017 Budget to the Board (Final Adoption) June 6, 2016 42* Advertise the tax digest for the five year history Fiscal Years 2011-2016 June 8, 2016 43* Advertise and publish notice of tax rate and budget June 8, 2016 44* Advertise the first and second public hearings for the tax Millage rates June 8, 2016 45 Board Budget Commission meeting (at call of Committee chair) June 9, 2016 46* Advertise the third public hearings for the tax Millage rates (If necessary) June 10, 2016 47* Hold the first and second public hearing on the tax Millage rate June 16, 2016 48* Hold the third public hearings for the tax Millage rates (If necessary) June 20, 2016 49* Final adoption of the tax Millage rates for Fiscal Year 2017 June 20, 2016 50* Deadline for millage rates to be delivered to Fulton County Tax Commissioner June 20, 2016 51 Tax assessor provides final appraisal values to the District August 1, 2016 *Proposed dates for the millage rate adoption and all related public hearings. 32
Multi-Year Scenario Revenue Assumptions -Continued 2% growth in State -Continued 3% Growth in Local -Flattening in Other Expenditure Assumptions -Continued growth in charter schools -Continued growth in pension cost -Continued growth in costs related to special education and MOE -Decline in CRCT Remediation funding -Continued growth and emphasis on funding school allotments and signature, flex, and cluster funds -Continued implementation of long-term pay parity and compensation plan -Flattening in all department budgets 33
Appendix 34
Big Bet Ideas: On Hold Big Ideas to Solve Longstanding APS Challenges The most intensive effort within the turnaround strategy targets the 15 lowest performing elementary schools. With additional funds we can scale up the targeted support interventions to support more turnaround schools. Cost Turnaround $21.1 million Additional Flex Per Pupil Additional flex per pupil funds will allow the resources for Principals to really be able to move their school in a new and unique direction, in alignment with our charter system status. $9.0 million A key component of our charter status is the alignment and strengthening of our clusters. Cluster Funds allow cluster- based planning, problem solving, and targeting efforts and resources to cluster specific challenges and strengths. Additional Cluster Funds $7.5 million Arts = $7.0 million Athletics and the arts enrich the academic environment and are integral components of the APS community. Additional funds in these areas allows for more rich and robust programs including building a Pre-K to 12th arts-integrated ecosystem to increase student achievement. Enhanced Art and Athletics Programs Athletics = $2.0 million 35


")
")
")