Explore stakeholder engagement for students with disabilities under IDEA B Indicator 8, with a special focus on parent involvement. Learn about the State Performance Plan, data analysis, and improvement strategies discussed in today's meeting.
Please find below an Image/Link to download the presentation.
The content on the website is provided AS IS for your information and personal use only. It may not be sold, licensed, or shared on other websites without obtaining consent from the author. If you encounter any issues during the download, it is possible that the publisher has removed the file from their server.
You are allowed to download the files provided on this website for personal or commercial use, subject to the condition that they are used lawfully. All files are the property of their respective owners.
The content on the website is provided AS IS for your information and personal use only. It may not be sold, licensed, or shared on other websites without obtaining consent from the author.
E N D
Presentation Transcript
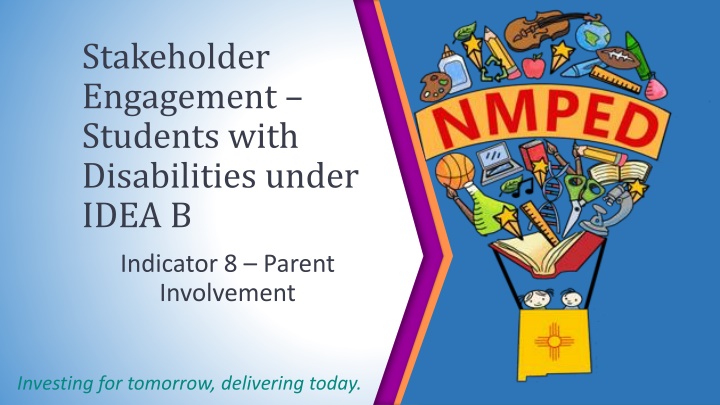
Stakeholder Engagement Students with Disabilities under IDEA B Indicator 8 Parent Involvement Investing for tomorrow, delivering today.
Todays Meeting Objectives Overview of the State Performance Plan (SPP)/Annual Performance (APR) required by the Individuals with Disabilities Education Act (IDEA)-Part B Review data available for Indicator: 8 Parent Involvement Stakeholder input on each Indicator Data Analysis Target Setting Evaluating Progress Improvement Strategies 2 Investing for tomorrow, delivering today.
Housekeeping Meeting Norms Everyone has valuable information to provide Raise your hand via Zoom Liz Schweiger will acknowledge those with raised hands Lower hand 3 Investing for tomorrow, delivering today.
Housekeeping Meeting Norms Parents/Guardians will have the option to provide input first Chat box available for questions Moderated by Leah Johnson Jamboard available for feedback Moderated by Matthew Kump Notes taken by Crystal Vigil 4 Investing for tomorrow, delivering today.
Individuals with Disabilities Education Act Part B A student that 1.Has a disability and 2.The need for specialized instruction Disability Categories: - Intellectual Disability - Hearing Impairment - Speech or Language Impairment - Visual Impairment - Emotional Disturbance - Orthopedic Impairment - Development Delayed (To age 8) - Autism - Traumatic Brain Injury - Other Heath Impairment - Specific Learning Disability - Deaf-Blindness - Multiple Disabilities Gifted Services are a New Mexico rule and gifted students are not counted in any of the data reported to the Office of Special Education Programs (OSEP) 7 Investing for tomorrow, delivering today.
Overview of the State Performance Plan (SPP)/ Annual Performance Report (APR) States receiving funds from the U.S. Department of Education, to implement the Individuals with Disabilities Education Act (IDEA) must develop a State Performance Plan (SPP) The SPP describes State efforts to meet the requirements and purposes of IDEA, Part B States must report on the performance of the SPP through the Annual Performance Report (APR) Completing the SPP and APR relies on the collection and use of a variety of data 8 Investing for tomorrow, delivering today.
IDEA B Indicators Reporting in the SPP/APR 2 Types of Indicators Compliance and Target Indicators Indicators up to FFY2019: Compliance Indicators Target Indicators Indicator 4B Suspension/Expulsion Indicator 1 Graduation Indicator 8 Parent Involvement Indicator 9 Disproportionate Representation Indicator 2 Drop out Indicator 14 Post-School Outcomes Indicator 10 Disproportionate Representation Indicator 3B & 3C Assessment Participation & Outcomes Indicator 15 Resolution Sessions Indicator 11 Child Find/60 Day Timeline Indicator 4A Suspension/Expulsion Indicator 16 Mediation Indicator 12 Part C to B Transition Indicator 5 Education Environments Indicator 13 Secondary Transition Indicator 6 Preschool Education Environments Indicator 7 Preschool Outcomes 9 Investing for tomorrow, delivering today.
Indicator 8 Information FFY 2019 Federal reporting measurement requirements FFY 2019 8. Percent of parents with a child receiving special education services who report that schools facilitated parent involvement as a means of improving services and results for children with disabilities. Data Source: Sampling of parents from whom response is requested is allowed. When sampling is used, submit a description of the sampling methodology outlining how the design will yield valid and reliable estimates. (See General Instructions on page 2 for additional instructions on sampling.) State selected data source. Measurement: Percent = [(# of respondent parents who report schools facilitated parent involvement as a means of improving services and results for children with disabilities) divided by the (total # of respondent parents of children with disabilities)] times 100. (20 U.S.C. 1416(a)(3)(A)) Describe the results of the calculations and compare the results to the target. Provide the actual numbers used in the calculation. If the State is using a separate data collection methodology for preschool children, the State must provide separate baseline data, targets, and actual target data or discuss the procedures used to combine data from school age and preschool data collection methodologies in a manner that is valid and reliable. While a survey is not required for this indicator, a State using a survey must submit a copy of any new or revised survey with its SPP/APR. Report the number of parents to whom the surveys were distributed. Include the State s analysis of the extent to which the demographics of the parents responding are representative of the demographics of children receiving special education services. States should consider categories such as race and ethnicity, age 12 Investing for tomorrow, delivering today.
Indicator 8 Information FFY 2019 Federal reporting measurement requirements FFY 2019 Monitoring Priorities and Indicators Data Source and Measurement Instructions for Indicators/Measurement of the student, disability category, and geographic location in the State. If the analysis shows that the demographics of the parents responding are not representative of the demographics of children receiving special education services in the State, describe the strategies that the State will use to ensure that in the future the response data are representative of those demographics. In identifying such strategies, the State should consider factors such as how the State distributed the survey to parents (e.g., by mail, by e- mail, on-line, by telephone, in-person through school personnel), and how responses were collected. States are encouraged to work in collaboration with their OSEP-funded parent centers in collecting data. 13 Investing for tomorrow, delivering today.
Indicator 8 Information FFY 2020-2025 Reporting measurement requirements FFY 2020-2025 8. Percent of parents with a child receiving special education services who report that schools facilitated parent involvement as a means of improving services and results for children with disabilities. Data Source: Sampling of parents from whom response is requested is allowed. When sampling is used, submit a description of the sampling methodology outlining how the design will yield valid and reliable estimates. (See General Instructions on page 2 for additional instructions on sampling.) State-selected data source. Measurement: (20 U.S.C. 1416(a)(3)(A)) Percent = [(# of respondent parents who report schools facilitated parent involvement as a means of improving services and results for children with disabilities) divided by the (total # of respondent parents of children with disabilities)] times 100. Describe the results of the calculations and compare the results to the target. Provide the actual numbers used in the calculation. If the State is using a separate data collection methodology for preschool children, the State must provide separate baseline data, targets, and actual target data or discuss the procedures used to combine data from school age and preschool data collection methodologies in a manner that is valid and reliable. While a survey is not required for this indicator, a State using a survey must submit a copy of any new or revised survey with its SPP/APR. Report the number of parents to whom the surveys were distributed and the number of respondent parents. The survey response rate is automatically calculated using the submitted data. States must compare the response rate for the reporting year to the response rate for the previous year (e.g., in the FFY 2020 SPP/APR, compare the FFY 2020 response rate to the FFY 2019 response rate) and describe strategies that will be implemented which are expected to increase the response rate, particularly for those groups that are underrepresented. The State must also analyze the response rate to identify potential nonresponse bias and take steps to 14 Investing for tomorrow, delivering today.
Indicator 8 Information FFY 2020-2025 Reporting measurement requirements FFY 2020-2025 Monitoring Priorities and Indicators Data Source and Measurement Instructions for Indicators/Measurement reduce any identified bias and promote response from a broad cross-section of parents of children with disabilities. Include in the State s analysis the extent to which the demographics of the children for whom parents responded are representative of the demographics of children receiving special education services. States must consider race and ethnicity. States must describe the metric used to determine representativeness (e.g., +/- 3% discrepancy in the proportion of responders compared to target group). If the analysis shows that the demographics of the parents responding are not representative of the demographics of children receiving special education services in the State, describe the strategies that the State will use to ensure that in the future the response data are representative of those demographics. In identifying such strategies, the State should consider factors such as how the State distributed the survey to parents (e.g., by mail, by e- mail, on-line, by telephone, in-person through school personnel), and how responses were collected. Beginning with the FFY 2021 SPP/APR, due February 1, 2023, when reporting the extent to which the demographics of the children for whom parents responded are representative of the demographics of children receiving special education services, States must include race and ethnicity in their analysis. In addition, the State s analysis must also include at least one of the following demographics: age of the student, disability category, gender, geographic location, and/or another demographic category approved through the stakeholder input process. States are encouraged to work in collaboration with their OSEP-funded parent centers in collecting data. 15 Investing for tomorrow, delivering today.
Indicator 8 Measurement # of respondent parents who report schools facilitated parent involvement as a means of improving services and results for children with disabilities total # of respondent parents of children with disabilities 16 Investing for tomorrow, delivering today.
Indicator 8: Big Picture States must determine the percent of parents who report that the schools facilitated parent involvement as a means of improving services and results for children with disabilities. Specifically, the state must measure this for parents of students with a disability. 17
NM Methodology NM selects a representative sample of students with disabilities (SWD) at each school at each district. Up to 20 SWD are selected at each school. Approximately 15,500 SWD are selected each year. Parents of these SWD are mailed a survey. This year to increase response rate, parents will also be emailed and texted. 18
NM Methodology The NM Parent Survey is a 25-item survey. Each question is rated on a Likert scale: Very Strongly Disagree Very Strongly Agree Strongly Disagree Disagree Strongly Agree Agree 1. The school encourages parent involvement as a way of improving services for my child. 1 2 3 4 5 6 19
NM Methodology Sample questions: Teachers treat me as a team member. I have been asked for my opinion about how well special education services are meeting my child s needs. Teachers and administrators encourage me to participate in the IEP decision-making process. My child s school communicates regularly with me regarding my child s progress on IEP goals. My child s school provides my child with all the services documented on my child s IEP. 20
NM Methodology To determine the State's Overall Parent Involvement Percentage, the percentage of parents who agreed, strongly agreed, or very strongly agreed to this question is calculated: "The school facilitated parent involvement as a means of improving services for my child(ren)." 21
NM Methodology Responses are weighted by the population of students with disabilities due to the differential sampling that is done at the district level and the different response rates by districts that are obtained. For example, if 5% of all SWD are enrolled at District A then the responses from District A get 5% of the weight when calculating the statewide results. 22
NM State Results 2019-20 state results: Weighted # of Parents who Received a Score Weighted # of Parents who Met Indicator % who Met Indicator 1,007.13 864.53 85.84% NM met the target of 84%. 23
NM District Results 2019-20 District Results 80 70 27 Districts Did Not Meet the Target 60 50 90 Districts Met the Target 40 30 20 10 0 0% 10% 20% 30% 40% 50% 60% 70% 80% 90% 100% 24
NM Reporting On the APR, NM needs to report on: Statewide results Response rate Representativeness 25
Indicator 8: Parent Involvement Changes Response Rate Report the number of parents to whom the state distributed surveys and the number of respondent parents States must compare the response rate for the reporting year to the response rate for the previous year (FFY 2020 SPP compare FFY 2020 response to FFY2019 response rate) Describe strategies the state will implement that are expected to increase the response rate, particularly for those groups that are underrepresented The state also must analyze the response rate to identify potential nonresponse bias and take steps to reduce any identified bias and promote response from abroad cross section of parents of children with disabilities 26 Investing for tomorrow, delivering today.
Indicator 8: Parent Involvement Changes NM Response Rate 2019-20 Number of Parents Who Received the Parent Survey: Number of Parents Who Completed the Parent Survey: Percentage of Parents Who Completed the Parent Survey: 15,906 1,015 6.38% District Response Rates ranged from 0-50% 26 districts had 0% response rate 22 districts had between 1-4.9% response rate 62 districts had between 5-9.9% response rate 34 districts had 10% or higher response rate 27 Investing for tomorrow, delivering today.
Indicator 8: Parent Involvement Changes Representativeness (Note: even though these are changes, NM has reported on this for several years.) Include in the state s analysis the extent to which the demographics of the children for whom parents responded are representative of the demographics of children receiving special education services. States must consider race and ethnicity. Describe the metric used to determine representativeness (e.g., +/- 3% discrepancy in the proportion of responders compared to target group). If data are not representative, describe the strategies to ensure that in the future the response data are representative of those demographics . Beginning with FFY 2021 (due Feb 1, 2023), include race/ethnicity in the analysis and at least one additional demographic: age, gender, geographic location or other category approved through stakeholder process. 28 Investing for tomorrow, delivering today.
Indicator 8: Parent Involvement Changes NM Representativeness Generally, parents of Hispanic students with disabilities are less likely to respond than parents of white students with disabilities Generally, results are representative by grade level and by disability category. 29 Investing for tomorrow, delivering today.
Context How does NM compare to other states? Parent involvement percent comparisons Target comparisons Response rate comparisons 30
Results By State 2018-19 99.57% 99.49% 98.66% 97.46% 97.31% 95.82% 94.44% 93.50% 92.87% 91.33% 90.98% 100% 89.90% 89.48% 89.41% 89.41% 89.00% 81.83% 87.77% 86.75% 86.56% 85.71% 85.65% 84.74% 83.62% 83.40% 80.05% 78.98% 78.38% 77.79% 76.70% 76.70% 75.62% 73.88% 73.00% 71.51% 71.20% 70.38% 70.00% 80% 69.94% 69.00% 68.29% 62.69% 57.42% 60% 47.90% 43.98% 40.97% 38.04% 37.63% 34.31% 32.09% 30.36% 30.27% 40% 20% 0% NM MS MN NH MD MT NJ MA ME MI NV MO NE DE NC BIE ND DC NY PA VA VT TN WA TX AR AL FL WI AZ WV KS WY SD KY SC IL GA LA ID UT IN OK OR IA OH CA RI HI CO CT AK 31
State Response Rates 2018-19 100% 100% 80% 60% 47% 36% 40% 33% 33% 30% 24% 23% 23% 23% 21% 20% 20% 20% 18% 18% 18% 16% 15% 20% 14% 14% 13% 13% 12% 11% 11% 10% 10% 10% 10% 6% 9% 9% 9% 9% 8% 8% 8% 7% 7% 7% 6% 6% 5% 5% 4% 4% 4% 2% 0% SD MD MA KS MS MI MN ID MT FL IL OK ME SC KY AR OH MO AZ OR CO IA RI UT IN CA AK WY CT WI WV WA NH NV ND NM LA NJ NY NC NE VT HI VA TX TN DE DC PA 32
All State Targets 2018-19 100% 96.45% 84.00% 80% 60% 40% 22.30% 20% 0% SD OR KY SC MO MD MA MI IL KS MT MN FL MS ME ID AK IA OK OH AR AZ IN WV RI CO AL UT CT WA NM CA BIE WY NJ WI NE NH ND VA NV LA VT NC HI TX TN NY PA GA DC DE 33
Context: NM Data How has NM data changed over time? Parent involvement percent over time Response rates over time Targets over time 34
New Mexico Results Over Time NM Parent Involvement Percent Over Time(Dark red is baseline.) 100% 90% 86.17% 85.84% 84.81% 84.70% 83.90% 84.21% 82.90% 82.69% 82.45% 81.83% 80.30% 80.20% 80% 70% 60% 50% 2008-09 2009-10 2010-11 2011-12 2012-13 2013-14 2014-15 2015-16 2016-17 2017-18 2018-19 2019-20 35
New Mexico Response Rates Over Time NM Response Rates Over Time 20% 14.74% 14.10% 15% 12.60% 11.85% 10.11% 9.31% 9.26% 10% 6.80% 6.38% 6.35% 6.06% 5% 0% 2009-10 2010-11 2011-12 2012-13 2013-14 2014-15 2015-16 2016-17 2017-18 2018-19 2019-20 36
New Mexico Targets Over Time NM Targets Over Time 90% 88.00% 87.50% 84.00% 84.00% 84.00% 84.00% 85% 83.00% 82.00% 81.80% 81.80% 81.30% 80.80% 80% 75% 2008-09 2009-10 2010-11 2011-12 2012-13 2013-14 2014-15 2015-16 2016-17 2017-18 2018-19 2019-20 37
Target-Setting How do we determine what our targets should be? Look at NM data over time. Look at forecasting/trend predictions. Think about how improved response rates might impact the results. Consider the baseline end target has to be above the baseline. 38
Target-Setting How do we determine what our targets should be? Think about what is possible and what is probable. What changes can districts make to increase the parent involvement percent? What changes will districts make to increase the parent involvement percent? 39
Forecasting What mathematical predictions for future scores are there? 88% 87% 86.17% 85.84% 86% 84.81% 85% 84.21% 84% 82.90% 83% 82.69% 82.45% 81.83% 82% 81% 80% 2012 2013 2014 2015 2016 2017 2018 2019 2020 2021 2022 2023 2024 2025 State Actual Target Average (Mean) Difference 4-Year Moving Average (Mean) Forecasting Linear Trend Increase Linear (State Actual) 40
Proposed Targets In deciding on the targets: Start with the end in mind. Where are we now? Where do we want to be at the end of the SPP (2025-26 school year)? Once we have the end point, NM can then determine the increments. Consider the 5 target options on the next graph. There of course are other target options that are either higher or lower than what is proposed here. You are free to consider what you think best! 41
Analyzing Data Guiding Questions Which data points stood out to you? Why? How is the state performing in regard to schools facilitating parent involvement as a means of improving services and results for children with disabilities? 44 Investing for tomorrow, delivering today.
Target Setting Guiding Questions Is the baseline appropriate? What should target(s) be? Should they increase each year? By what increments? 46 Investing for tomorrow, delivering today.
Evaluating Progress Guiding Questions What demonstrates the State is making progress with Indicator 8? What factors could potentially impact progress? 48 Investing for tomorrow, delivering today.
Improvement Strategies Guiding Questions What are some improvements required to improve schools facilitating parent involvement as a means of improving services and results for children with disabilities? 50 Investing for tomorrow, delivering today.


/")