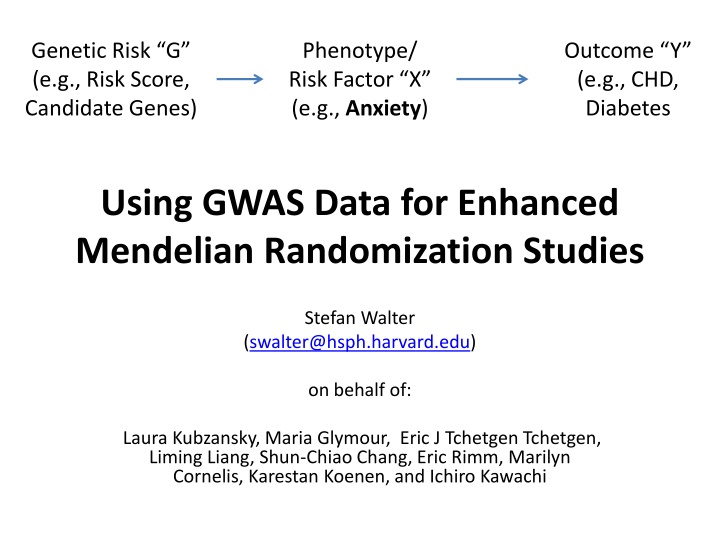
Explore the application of genetic risk scores in enhanced Mendelian randomization studies to investigate the relationships between genetic risk, phenotypes such as anxiety and depression, and outcomes like CHD and diabetes using GWAS data. The study delves into projects focusing on anxiety, depression, and social ties, providing insights into genetic instruments, results, advantages, and challenges in the analysis.
Please find below an Image/Link to download the presentation.
The content on the website is provided AS IS for your information and personal use only. It may not be sold, licensed, or shared on other websites without obtaining consent from the author. If you encounter any issues during the download, it is possible that the publisher has removed the file from their server.
You are allowed to download the files provided on this website for personal or commercial use, subject to the condition that they are used lawfully. All files are the property of their respective owners.
The content on the website is provided AS IS for your information and personal use only. It may not be sold, licensed, or shared on other websites without obtaining consent from the author.
E N D
Presentation Transcript
Genetic Risk G (e.g., Risk Score, Candidate Genes) Phenotype/ Risk Factor X (e.g., Anxiety) Outcome Y (e.g., CHD, Diabetes Using GWAS Data for Enhanced Mendelian Randomization Studies Stefan Walter (swalter@hsph.harvard.edu) on behalf of: Laura Kubzansky, Maria Glymour, Eric J Tchetgen Tchetgen, Liming Liang, Shun-Chiao Chang, Eric Rimm, Marilyn Cornelis, Karestan Koenen, and Ichiro Kawachi
Outline Setting Projects: Anxiety, Depression, Social Ties Results Methods and Instruments: Using the Genetic Risk Score as an Instrument Leave One Out Approach Instrumental Inequality Tests Future: including interactions in score (GxG, GxE)
Setting NHS I n = 7000 (NHST2D, NHSCGEMS, NHSCHD, NHSKS) age at blood draw = 59.5 (SD 8) HPFS n = 4125 (HPFST2D, HPFSCHD, HPFSKS) age at blood draw = 62.2 (SD 9) Genotyped on different chips (Illumina, Affy), HapMap and 1000g imputation available.
Projects Anxiety: Crown Crisp Experimental Index (phobic anxiety) Depression long-term composite depressive symptom score (1992-2006). Social Ties social isolation and ability to connect with others (continuously married versus otherwise).
Results Depression and Anxiety: No evidence of a genetic instrument from additive internal GWA risk score, candidate genes, or external GWA risk score (R2 < 0.1%, mostly not significant) But inconsistent results from chip heritability (GCTA): NHS_T2D, Affy 6.0, NHS_CGE, Illumina 550k, NHS_CHD, Affy 6.0, NHS_KS, Illumina 610Q, HPFS_T2D, Affy 6.0, HPFS_CHD, Affy 6.0, HPFS_KS, Illumina 610k, 0.214349 0.062074 0.305586 0.000001 0.214349 0.200122 0.046558
Genetic Risk G (e.g., Risk Score, Candidate Genes) Phenotype/ Risk Factor X (e.g., BMI) Outcome Y (e.g., Anxiety, Depression, Social Ties) Advantage: Known genetic relationship for BMI (Speliotes et al. Association analyses of 249,796 individuals reveal 18 new loci associated with body mass index). Replicates in NHS/HPFS explaining 2% of variance. Challenge: Analysis within nested case-control (NCC) samples (all but KS) requires IP weighting to allow unbiased inference based on the original sampling population. Currently, we are recreating the risk sets based on the published matching criteria used to derive the NCC.
Methods and Instruments (1): Genetic Risk Score applying allele scoring (Purcell et al., 2009): Derived from internal GWAS Approach: running GWAS in 7 samples, meta-analyzing 6 and scoring in set number 7. Iterative leave one out procedure and subsequent meta-analysis of results. Derived from published GWAS (Speliotes et al, 2010; Demirkan et al., 2010) Derived from Candidate Genes
Methods and Instruments (2): Glymour, Tchetgen Tchetgen, Robins., Credible Mendelian Randomization Studies: Approaches for Evaluating the Instrumental Variable Assumptions, Am J Epi 2012 Genetic IVs cannot be proven to be valid. They can sometimes be shown to be invalid, although these tests generally rely on additional assumptions. Four empirical approaches to (in)validation: Leverage prior causal assumptions regarding the confounding of the phenotype- outcome association: 4 equivalent versions of this test. Identify factors that modify the genotype-phenotype association and compare the IV effect estimate across values of the modifier. Instrumental inequality tests: applicable only when the causal phenotype is known to be categorical. Over-identification tests with multiple IVs. Other genes or even polymorphisms of the same gene might provide additional IVs. *Instrumental Inequality Test Macros available (R, SAS) for dichtomous outcome, dichotomous phenotype, and ploytomous instruments
Future Testing and including GxG, GxE - Known Protein x Protein interactions to inform underlying SNP x SNP interactions. (anxiety) - Investigate gender differences. (anxiety) - Quantile Regression to identify and quantify interactions with (unknown) environmental factors. - Construct separate scores based on presumed mechanism (e.g., appetite, adipogenesis, cardio- pulmonary fitness) and apply over-identification tests. - Get access to the Health Retirement Study genetic data from dbGaP to increase sample size for psycho-social phenotypes.
Acknowledgements & Contact: NIH/NIHM 1RC4MH092707 (L Kubzansky) And the entire team: Laura Kubzansky, Maria Glymour, Eric J Tchetgen Tchetgen, Liming Liang, Shun-Chiao Chang, Eric Rimm, Marilyn Cornelis, Karestan Koenen, and Ichiro Kawachi Please feel free to contact us, we are happy to share thoughts, code, macros, etc. Stefan: swalter@hsph.harvard.edu Laura: lkubzans@hsph.harvard.edu Maria: mglymour@hsph.harvard.edu


:")
:")