Enhancing Credit Scoring Models for ERCOT and MISO
"Explore the recalibration and optimization process of credit scoring models used by ERCOT and MISO, highlighting the importance of model support and explanatory power. Discover the next steps in finalizing and incorporating these models for improved financial assessment." (286 characters)
Uploaded on | 1 Views
Download Presentation

Please find below an Image/Link to download the presentation.
The content on the website is provided AS IS for your information and personal use only. It may not be sold, licensed, or shared on other websites without obtaining consent from the author. If you encounter any issues during the download, it is possible that the publisher has removed the file from their server.
You are allowed to download the files provided on this website for personal or commercial use, subject to the condition that they are used lawfully. All files are the property of their respective owners.
The content on the website is provided AS IS for your information and personal use only. It may not be sold, licensed, or shared on other websites without obtaining consent from the author.
E N D
Presentation Transcript
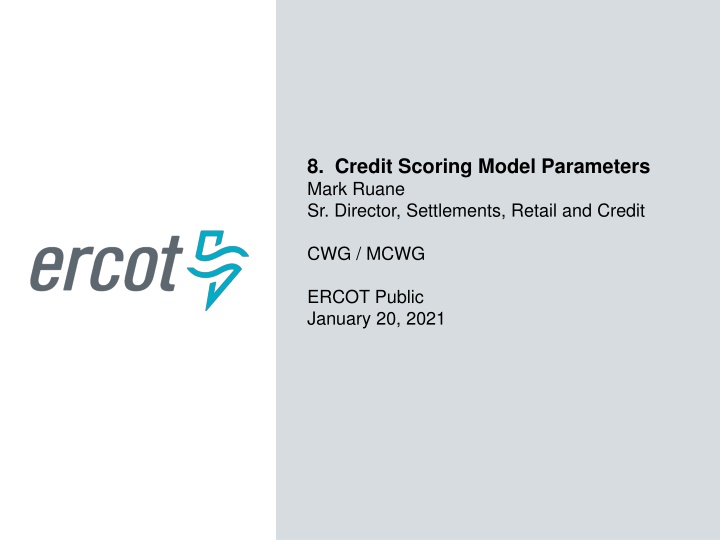
8. Credit Scoring Model Parameters Mark Ruane Sr. Director, Settlements, Retail and Credit CWG / MCWG ERCOT Public January 20, 2021
Credit Scoring Model Parameters Recap: CWG/MCWG reviewed recalibrated versions of credit scoring models used by ERCOT and MISO. Test models were recalibrated using on 2018 and 2019 ERCOT Counter-Party financial data Calibration was done by optimizing the R^2s between model results and agency ratings (where available) There appeared to be more support for the MISO-derived model based on: Better explanatory power Two sub-models: for public power and non-public power Entities 2 ERCOT Public
Credit Scoring Model Parameters Next steps: Finalize model, ratios and weightings Incorporate results in an OBD 3 ERCOT Public
Credit Scoring Model Parameters The weightings below are based on the average of 2018 and 2019 optimization weightings, rounded to 5%. Credit Ratios for Non-Public Entities Credit Ratios for Public Entities Ratio Type Liquidity Liquidity Liquidity Liquidity Leverage Leverage Leverage Leverage Performance Performance Performance Performance Total Weight Ratio Weight EBITDA/Interest expense Cash Earnings/Debt Service Free Cash flow/Total Debt Quick Ratio Debt/Total Capitalization Short Term Debt/Total Debt Debt/Net Fixed Assets Debt/TNW Return on Sales Return on Assets Operating Margin Return on Equity 0% 0% 25% 0% 15% 0% 15% 5% 0% 0% 25% 15% 100% Days Cash/SGA+Interest Expense Debt Service Coverage Equity/Total Assets Times Interest Earned Cash/Current Liabilities CFFO/Total Debt Capex/Sales Total 0% 0% 50% 50% 0% 0% 0% 100% 4 ERCOT Public
Credit Scoring Model Parameters Appendices 5 ERCOT Public
Credit Scoring Model Parameters MISO-based financial scoring model 6 ERCOT Public
Credit Scoring Model Parameters Financial Scoring Models Updated using 2019 Counter-Party financial data For both testing models, revised data reduced the fit of the model score to the agency rating for rated entities. Changes to weightings and sector results follow. 7 ERCOT Public
Credit Scoring Model Parameters MISO-based model score results by ERCOT-defined segment: 2018 financial data (both classes). Public Power Non-Public Power Model Load + Gen Load + Gen CRRAH All Load Trader Gen CRRAH All All CPs Count Average Median Max (worst) Min (best) Stdev. Skewness 9 8 17 33 128 3.14 2.69 6.98 1.00 1.78 0.52 21 32 22 236 3.43 3.31 6.98 1.00 1.64 0.31 253 3.35 3.27 6.98 1.00 1.63 0.39 2.41 2.42 3.49 1.84 0.55 0.61 1.97 1.54 4.27 1.27 0.94 2.10 2.20 1.90 4.27 1.27 0.79 1.14 4.23 3.73 6.91 1.34 1.68 0.10 3.87 3.86 6.30 1.31 1.28 -0.04 3.51 3.69 6.34 1.00 0.97 0.11 3.35 3.44 5.25 1.00 1.32 -0.04 Note that lower scores indicate higher credit quality. Scores can be duplicated when different CPs have same guarantor. 8 ERCOT Public
Credit Scoring Model Parameters MISO-based model score results by segment: 2019 financial data, calibrated using 2018 financial data Public Power Non-Public Power Model Load + Gen Load + Gen CRRAH All Load Trader Gen CRRAH All All CPs Count Average Median Max (worst) Min (best) Stdev. Skewness 9 8 18 32 130 3.01 2.75 6.99 1.00 1.59 0.23 24 33 25 244 3.31 3.34 6.99 1.00 1.48 0.07 262 3.25 3.26 6.99 1.00 1.47 0.13 2.37 2.44 3.20 1.82 0.48 0.40 2.29 1.52 4.69 1.25 1.33 1.31 2.48 2.05 4.94 1.25 1.12 1.14 4.03 3.87 6.91 1.34 1.44 0.25 3.29 3.12 6.19 1.00 1.25 0.56 3.53 3.42 5.78 1.00 0.92 -0.15 3.66 3.96 5.58 1.00 1.22 -0.64 Note that lower scores indicate higher credit quality. Scores can be duplicated when different CPs have same guarantor. 9 ERCOT Public
Credit Scoring Model Parameters MISO-based model score results by segment: 2019 financial data, calibrated using 2019 financial data (both classes). Public Power Non-Public Power Model Load + Gen Load + Gen CRRAH All Load Trader Gen CRRAH All All CPs Count Average Median Max (worst) Min (best) Stdev. Skewness 9 8 18 32 130 2.68 2.55 5.67 1.00 1.38 0.21 24 33 25 244 3.00 3.22 5.72 1.00 1.32 -0.06 262 2.93 3.15 6.99 1.00 1.39 0.15 1.40 1.27 2.08 1.00 0.39 0.51 2.50 1.00 6.99 1.00 2.59 1.44 2.00 1.06 6.99 1.00 1.86 2.28 3.65 3.53 5.72 1.77 0.94 0.09 3.29 3.20 5.26 1.00 1.34 -0.07 3.28 3.53 5.60 1.00 1.07 -0.20 3.18 3.52 5.26 1.00 1.21 -0.28 Note that lower scores indicate higher credit quality. Scores can be duplicated when different CPs have same guarantor. 1 0 ERCOT Public
Credit Scoring Model Parameters MISO Model Results Comparison 80 70 60 50 40 30 20 10 0 1 2 3 4 5 6 7 2018 data 2019 data calibrated on 2018 2019 data calibrated on 2019 1 1 ERCOT Public
Credit Scoring Model Parameters MISO-based model weightings, calibrated using 2018 financial data. Non-Public Power Public Power Ratio Category Liquidity Liquidity Liquidity Liquidity Weight Ratio Weight EBITDA/Interest expense Cash Earnings/Debt Service Free Cash flow/Total Debt Quick Ratio 0% 0% 24% 0% Days Cash/SGA+Interest Expense Debt Service Coverage Equity/Total Assets Times Interest Earned Cash/Current Liabilities CFFO/Total Debt Capex/Sales Total 0% 0% 49% 51% 0% 0% 0% 100% Debt/Total Capitalization Short Term Debt/Total Debt Leverage Debt/Net Fixed Assets Debt/TNW Leverage 1% 0% 29% 0% Leverage Leverage Return on Sales Return on Assets Operating Margin Return on Equity Performance Performance Performance Performance 1% 0% 14% 31% Total 100% 1 2 ERCOT Public
Credit Scoring Model Parameters MISO-based model weightings, calibrated using 2019 financial data. Quantitative Ratios Non-Public Quantitative Ratios Public Ratio Type Liquidity Liquidity Liquidity Liquidity Leverage Weight Ratio Weight EBITDA/Interest expense Cash Earnings/Debt Service Free Cash flow/Total Debt Quick Ratio Debt/Total Capitalization Short Term Debt/Total Debt Leverage Debt/Net Fixed Assets Debt/TNW Return on Sales Return on Assets Operating Margin Return on Equity 0% 0% 28% 0% 32% 0% 0% 6% 3% 0% 31% 0% 100% Days Cash/SGA+Interest Expense Debt Service Coverage Equity/Total Assets Times Interest Earned Cash/Current Liabilities CFFO/Total Debt Capex/Sales Total 0% 0% 47% 53% 0% 0% 0% 100% Leverage Leverage Performance Performance Performance Performance Total 1 3 ERCOT Public
Credit Scoring Model Parameters MISO-based model ratio bounds. Non-Public Power Public Power Ratio Category Liquidity Liquidity Liquidity Liquidity Min Max Ratio Min Min EBITDA/Interest expense Cash Earnings/Debt Service Free Cash flow/Total Debt Quick Ratio - - - - 9.00 8.00 0.50 1.25 Days Cash/SGA+Interest Expense Debt Service Coverage Equity/Total Assets Times Interest Earned Cash/Current Liabilities CFFO/Total Debt Capex/Sales - 143.89 0.03 2.05 677 1.80 0.83 2.00 0.01 0.01 0.66 0.01 0.01 0.01 Debt/Total Capitalization Short Term Debt/Total Debt Leverage Debt/Net Fixed Assets Debt/TNW Leverage 0.01 0.01 0.01 0.01 0.70 1.00 2.00 12.99 Leverage Leverage Return on Sales Return on Assets Operating Margin Return on Equity Performance Performance Performance Performance NA 0.01 0.01 0.01 16.00 6.00 30.00 15.00 1 4 ERCOT Public
Credit Scoring Model Parameters ERCOT financial scoring model 1 5 ERCOT Public
Credit Scoring Model Parameters ERCOT model score results by segment: 2018 financial data Load + Gen Load Trader Gen CRRAH All Count Average Median Min (worst) Max (best) Stdev. Skewness 33 128 3.69 3.30 0.61 6.86 1.95 0.26 30 32 30 253 3.14 2.44 0.05 6.86 1.71 0.83 2.42 2.20 0.93 5.79 1.15 1.70 2.26 2.20 1.17 5.00 0.75 2.29 2.49 2.58 0.05 5.48 1.03 0.53 3.18 2.46 1.43 6.60 1.51 1.04 Note that higher scores indicate higher credit quality. Scores can be duplicated when different CPs have same guarantor. 1 6 ERCOT Public
Credit Scoring Model Parameters ERCOT model score results by segment: 2019 financial data, calibrated using 2018 financial data Load + Gen Load Trader Gen CRRAH All Count Average Median Min (worst) Max (best) Stdev. Skewness 32 130 6.08 6.01 1.18 10.00 2.12 0.13 33 34 33 262 5.22 4.44 1.02 10.00 1.93 0.81 4.24 4.05 1.39 8.06 1.26 0.94 4.40 4.25 3.59 5.69 0.55 0.83 4.13 4.15 1.02 6.81 1.00 -0.20 4.70 4.00 2.48 10.00 1.73 1.51 Note that higher scores indicate higher credit quality. Scores can be duplicated when different CPs have same guarantor. 1 7 ERCOT Public
Credit Scoring Model Parameters ERCOT model score results by segment: 2019 financial data, calibrated using 2019 financial data Load + Gen Load Trader Gen CRRAH All Count Average Median Min (worst) Max (best) Stdev. Skewness 32 130 5.53 6.59 0.31 10.00 3.44 -0.12 33 34 33 262 4.00 2.21 0.31 10.00 3.24 0.73 2.85 1.48 0.41 10.00 2.62 1.70 1.83 1.48 0.89 4.77 0.85 1.57 2.05 1.59 0.89 5.91 1.29 1.73 3.32 1.80 0.98 10.00 2.83 1.33 Note that higher scores indicate higher credit quality. Scores can be duplicated when different CPs have same guarantor. 1 8 ERCOT Public
Credit Scoring Model Parameters ERCOT Model Results Comparison 120 100 80 60 40 20 0 1 2 3 4 5 6 7 8 9 10 2018 data 2019 data calibrated on 2018 2019 data calibrated on 2019 1 9 ERCOT Public
Credit Scoring Model Parameters ERCOT model weightings calibrated using 2018 financial data. Ratio Working Capital/Sales Cash/Assets Current Ratio EBITDA/Interest expense Debt Service CFO/Sales FCF/Debt Total Debt/Total Capital Leverage Equity/Assets EBITDA/Sales Net Income/Assets Total Assets Tangible Net Worth Sales/Assets Alternative Metric 1 Alternative Metric 2 Category Liquidity Liquidity Liquidity Weight 0% 0% 40% 8% 0% 0% 16% 6% 20% 10% 0% 0% 0% 0% 0% 100% Debt Service Debt Service Leverage Profitability Profitability Size Size Activity Total 2 0 ERCOT Public
Credit Scoring Model Parameters ERCOT model weightings calibrated using 2019 financial data. Ratio Working Capital/Sales Cash/Assets Current Ratio EBITDA/Interest expense Debt Service CFO/Sales FCF/Debt Total Debt/Total Capital Leverage Equity/Assets EBITDA/Sales Net Income/Assets Total Assets Tangible Net Worth Sales/Assets Alternative Metric 1 Alternative Metric 2 Category Liquidity Liquidity Liquidity Weight 8% 19% 58% 0% 0% 0% 0% 12% 4% 0% 0% 0% 0% 0% 0% 100% Debt Service Debt Service Leverage Profitability Profitability Size Size Activity Total 2 1 ERCOT Public
Credit Scoring Model Parameters ERCOT model ratio bounds Ratio Working Capital/Sales Cash/Assets Current Ratio EBITDA/Interest expense Debt Service CFO/Sales FCF/Debt Total Debt/Total Capital Leverage Equity/Assets EBITDA/Sales Net Income/Assets Total Assets Tangible Net Worth Sales/Assets Category Liquidity Liquidity Liquidity Min Max (5.00) 5.00 (10.00) (5.00) - 10.00 10.00 5.00 Debt Service Debt Service Leverage Profitability Profitability Size Size Activity (1.00) NA NA NA NA 2.00 2 2 ERCOT Public
Credit Scoring Model Parameters Discussion / next steps 2 3 ERCOT Public


