Enhancing Data Analytic Skills with Stata: PRIMR Study Overview
Dive into data analysis using Stata with a focus on the PRIMR Kenya study, exploring methodologies like Difference-in-Difference values and regressions to assess impacts on student achievement in reading and math. Gain insights into the study scope, aims, intervention strategies, and sample considerations.
Download Presentation

Please find below an Image/Link to download the presentation.
The content on the website is provided AS IS for your information and personal use only. It may not be sold, licensed, or shared on other websites without obtaining consent from the author.If you encounter any issues during the download, it is possible that the publisher has removed the file from their server.
You are allowed to download the files provided on this website for personal or commercial use, subject to the condition that they are used lawfully. All files are the property of their respective owners.
The content on the website is provided AS IS for your information and personal use only. It may not be sold, licensed, or shared on other websites without obtaining consent from the author.
E N D
Presentation Transcript
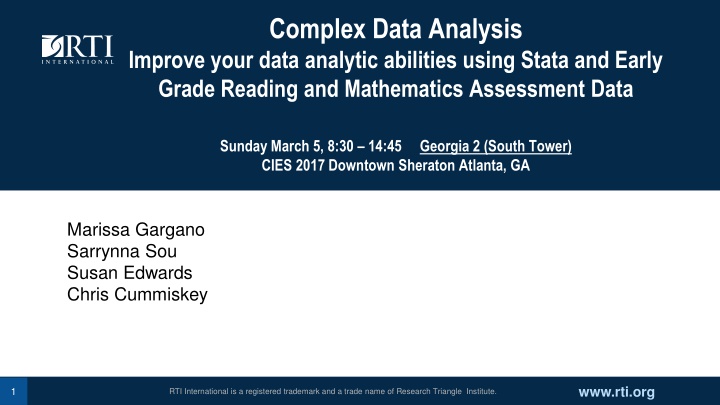
Complex Data Analysis Improve your data analytic abilities using Stata and Early Grade Reading and Mathematics Assessment Data Sunday March 5, 8:30 14:45 Georgia 2 (South Tower) CIES 2017 Downtown Sheraton Atlanta, GA Marissa Gargano Sarrynna Sou Susan Edwards Chris Cummiskey Marissa Gargano Sarrynna Sou Susan Edwards Chris Cummiskey www.rti.org 1 RTI International is a registered trademark and a trade name of Research Triangle Institute.
Outline of Intervention Workshop Introduce the PRIMR Study Background Establish and address direct aims Difference-in-Difference (DiD) Values Explain what a DiD is and how it s calculated Regressions Set up models; Link DiD and t-tests calculations to the regression output 2
Overview of PRIMR Kenya Study Scope Apply innovative, data-based instructional improvement methods to increase students fundamental skills in reading and mathematics Purpose Create a sustainable reading and mathematics program could be implemented Assessment tool EGRA-EGMA Time frame January 2012 October 2013 Grades 1 and 2 3
Overview of Workshop Data Set Subset of PRIMR Kenya study C1 and C3 Oct 2012 2013 Grade 2 Midterm A will be our baseline Disclaimer: Results from this workshop will not reflect published estimates from this study 4
Overview of Workshop Data Set Treatment/ year Control Full Treatment 2012 377 536 913 2013 400 522 922 Total 777 1,058 1,835 Gender/ Grade Male Female Second 893 942 1,835 5
Aims Primary AIM Did PRIMR have an effect on pupil achievement in reading and math? Did the treatment work? Secondary AIM Was the treatment more effective in the public or non-formal schools? 6
Sample How were the students sampled? Do we resample at end line or use the same schools from baseline? Intervention Assessment Only? Resample not needed. Another population level estimate? Depends . . . Is there concern about fidelity of implementation? Assumption: No time changes in the population. 7
Baseline Sampling Public Schools Stage Number Item Sampled Stratified by FPC Randomly selected half of schools in the zone Stage 1 Schools (182) Total schools in the zone Gender (2); students were randomly selected for assessment Total class 1 and 2 female/ male Stage 2 Students (1,900) Nonformal Schools Stage Number Item Sampled Stratified by FPC Randomly selected half of schools in the zone Stage 1 Schools (225) Total schools in the zone Gender (2); students were randomly selected for assessment Total class 1 and 2 female/ male Stage 2 Students (2,500) 8
Appending and Merging Goal: Set up the final data set with baseline and endline data. Problem: We have two separate data sets Baseline Endline How do we bring these data sets together in Stata? 10
Appending and Merging - WHEN Append Stacking Datasets one long dataset when you have separate baseline, midterm, or end line data Merge Linking Datasets one wide dataset Same students are tested in two different languages School Level Demographics (SSME) Longitudinal 11
Appending and Merging APPENDING IN STATA Example Code: 12
Address Aims Goal: Address the following aims by calculating simple baseline and end line comparisons. Did PRIMR have an effect on pupil achievement in reading and math? Was the treatment more effective in the public or non-formal schools? 13
Simple Comparisons Null Hypothesis No difference between the two groups in question Alternative Hypothesis There is a significant difference between the two groups in question Rejection Level (Alpha Level) The probability of the difference not occurring due to chance Test Statistic Level of Significance (p-value) 14
Simple Comparisons Activity Activity: Please open up do file \\Kenya PRIMR Comparison Activity.do There is a list of questions to help guide you through calculating weighted simple comparisons 15
Discussion What did you find most interesting from these comparisons? Were there issues you came across during the activity? If so, may you state them? We see that there a differences between mean values, now how do we measure how big these differences are? 18
