Enhancing Employer Demographics with Administrative Records Beyond Nonemployer Statistics
Explore the expansion of using administrative records to assign demographics to employer firms in the U.S., aiming to improve data products, reduce costs, and enhance business programs. This project aims to facilitate linkages of external and internal business data while improving the sampling frame for business surveys.

Uploaded on | 1 Views
Download Presentation

Please find below an Image/Link to download the presentation.
The content on the website is provided AS IS for your information and personal use only. It may not be sold, licensed, or shared on other websites without obtaining consent from the author. If you encounter any issues during the download, it is possible that the publisher has removed the file from their server.
You are allowed to download the files provided on this website for personal or commercial use, subject to the condition that they are used lawfully. All files are the property of their respective owners.
The content on the website is provided AS IS for your information and personal use only. It may not be sold, licensed, or shared on other websites without obtaining consent from the author.
E N D
Presentation Transcript
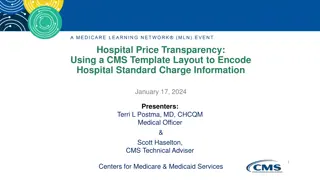
Can It Work for Employers? Evaluating the Expansion of Administrative Records Use beyond Nonemployer Demographic Statistics (NES-D) Adela Luque, Census Bureau (presenter) with Valeska Araujo, John Earle, Lorenz Eckerd, Vitaliy Novik, Jared Wold, Sammy Young, James Noon & Michaela Dillon FedCASIC, April 16, 2024 Valeska Araujo, George Mason University Ph.D candidate & Census Bureau; John Earle, George Mason University, IZA & Census Bureau; Lorenz Eckerd, Census Bureau; Vitaliy Novik, George Washington University Ph.D. candidate & Census Bureau; Jared Wold, George Mason University Ph.D candidate & Census Bureau; Sammy Young, Arizona State University & Census Bureau; James Noon and Michaela Dillon, Census Bureau. 1
Disclaimer Any opinions and conclusions expressed herein are those of the author(s) and do not reflect the views of the U.S. Census Bureau. The Census Bureau has reviewed this data product to ensure appropriate access, use, and disclosure avoidance protection of the confidential source data (Project No. P-7504866, Disclosure Review Board (DRB) approval number: CBDRB-FY23- ESMD010-037 and CBDRB-FY24-ESMD010-005). 2
Employer Demographics Project Employer Demographics Project Assign demographics to employer firms in the U.S. by leveraging administrative records (AR) & Census data Already accomplished for nonemployer firms (Nonemployer Statistics by Demographics, NES-D) Explore alternative ways to demographically classify (e.g., executive-based for public firms) Goal Benefits & Uses New data products & improvements, such as: - Unburdening surveys - Enhancing business programs w/ demographics - More granularity and flexibility Facilitate linkages of external & internal business data to business owners demographics Reduce costs Improve sampling frame for business surveys 3
Context Context - -The Annualization of Census Business Demographics Statistics The Annualization of Census Business Demographics Statistics Legacy Survey of Business Owners (SBO) - Every 5 yrs. (Nonemployers & Employers Demographics) BEFORE Annual Business Survey (ABS) (Employers) Nonemployer Statistics by Demographics (NES-D) + CURRENTLY Administrative Records (AR) - based Survey-based Annual Business Demographics Program Synchronization of employers & nonemployers 4
Employer Demographics Project as part of Annual Business Demographics Program Employer Demographics Project as part of Annual Business Demographics Program Annual Business Survey (ABS) (Employers) Nonemployer Statistics by Demographics (NES-D) AR based Survey-based (Not a survey) Employer Demographics Project AR-based (Not a survey) Annual Total Business Demographics Program 5
Data Sources Data Sources Variables Data Sources Business Register: Comprehensive database of all U.S. employer & nonemployer business establishments containing business name, identifier, address, industry classification, legal form of organization, receipts, and employment and payroll. Employer firm identifiers, Legal Form of Organization (LFO), employment, payroll, industry, geography Race Hispanic origin Sex Age of owner Place of birth U.S. Citizenship status Decennial Census Data, American Community Survey (ACS), & Numident (from Social Security Administration) Department of Veterans Affairs (VA) AR data (USVETS). Also exploring Department of Defense data. Veteran-status Owner Identifiers (Protected Identification Keys or PIKs) Tax data: 1040 filings, Schedule K-1, EIN applications (SS-4 form) 6
Methodology (1/2) Methodology (1/2) How are demographics assigned? How are demographics assigned? Employer universe identified & extracted from Business Register* Unique anonymized person identifiers called Protected Identification Keys (PIKs) facilitate linkage of records across data sources Source of PIKs / Owner identification Sole proprietors Tax form 1040 and EIN applications (SS-4 form) Partnerships & S-corporations Schedule K-1 (Forms 1065 & 1022S) Owners of U.S. nonemployer C-corporations cannot be identified with tax or AR data => Evaluating feasibility of demographics imputation for small C-corps => Longer term: Evaluate feasibility of classifying public corporations based on executives or board members demographics *The BR is a comprehensive database of all U.S. employer and nonemployer business establishments containing business name, identifier, address, industry classification, legal form of organization, receipts, and employment and payroll (these last two apply only to employer firms). 7
Methodology (2/2) Methodology (2/2) How are demographics assigned? How are demographics assigned? Link demographics from various sources to business owners via PIK Roll-up owner-level demographics to firm-level Majority rule: Business is assigned the demographic of the group that jointly owns > 50% of the business For instance, a business is black-owned if owners of black race own more than 50% of the business Eligible for demographic classification if top owner in firm owns at least 10% Top 4 (person) owners are considered 8
Owner PIK Coverage Results Owner PIK Coverage Results 2018 Employers 2018 Employers Owner PIKs available for approximately: oSoleprops (~ 97%) Demographics will be imputed for those without PIKs oScorps (~ 95%) Demographics will be imputed for those without PIKs oPartnership (~ 76%) Demographics will be imputed for those without PIKs => Approximately 90 95 percent of non C-corps, accounting for ~ 90 percent of (non C-corp) employment graph 9
Taking Stock Taking Stock - - AR AR- -based Employer Owner based Employer Owner- -identification Coverage identification Coverage Share of employer universe covered Share of rcpts/emp covered Legal Form of Organization (LFO) Methodology 76% AR 7% imputation Sole-props, Partnerships & S-corps 83% of employers* 49% emp Small C-corporations 14% of employers* 3% emp Imputation Public C-corporations (long term) < 1% of employers*** Approx. 23% emp*** Third-party data? Large Private C-corporations Approx. 3%** Approx. 25%** Survey 10
Can we leverage AR for employer demographics? Can we leverage AR for employer demographics? We think so! Sole proprietorships, partnerships and S-corporations Modeling for small private C-corps? Alternative non owner-based demographics for public corporations? Rely on survey for large private C-corporations? Some of them likely not to be eligible for demographic classification 11
Thank you! Adela.Luque@census.gov 12
Some Challenges Some Challenges Complex ownership structures makes it hard to identify owners Owner identification is closely tied to LFO (e.g., sole proprietorship, partnership, S-corp), but sometimes LFO changes are intractable Ownership information for partnerships & S-corps are tied to EINs that firms use for income tax purpose, but EINs in Business Register are the ones firms use for payroll purposes Sometimes firm income EIN not equal to payroll EIN => inability to identify owners in those cases C-corporations graphic 13
Next Steps Next Steps QA, QA, QA! Extension to multiple years o More QA - Evaluate longitudinal consistency & patterns Demographics imputation for partnerships & S-corps for which we have not been able to identify owners Evaluate feasibility of demographic imputation for small C- corporations Longer term - Explore alternative, not owner-based firm demographic classification (e.g., executive-based) 14
Demographics Coverage Results Demographics Coverage Results 2018 Employers (2/2) 2018 Employers (2/2) Availability of sex, age, place of birth for approximately 97% of owners (w/ PIKs) Availability of race for approximately 92% of owners (w/ PIKs) Availability of Hispanic origin for approximately 95% of owners (w/ PIKs) Approximately 92% of owners (w/ PIKs) are not missing any demographics Only about 3% percent are missing 3 or more demographics Missing demographics will be imputed 15
Owner Identification for Partnerships & S-corps Business Register (BR) K-1 tax data Linked by EIN Income EIN Owner PIK pairs Payroll EINs Identified owners of employer firms in BR (PIK EIN pairs) back 16
The Challenge of Multiple EINs BR has payroll EINs Schedule K-1 data: income EIN owner PIK pairs, & ownership info back 17
Taking Stock Taking Stock 18
Source of PIKs for Employers Firms Source of PIKs for Employers Firms Employer Firms (excluding non-profits, government, other non-corporate) C-corporations Partnerships Sole Proprietorships S-corporations (>= 1 owner) (>1 owner) (1 owner) (>=1 owner) 1040 filings & EIN applications n/a Source of PIKs Tax Schedule K1 Tax Schedule K1 Source: 2018 Business Register, U.S. Census Bureau. back 19
Preview of Owner Identification for non C-corps Employer Businesses (excluding non-profits, government, other non-corporate) S-corps C-corps Partnerships Soleprops ~18% of employers ~55% of employers ~13% of employers ~15% of employers ~ 97% of soleprops ~ 77% of partnerships ~ 95% of S-corps Private Small C- corps* ~ 87% of SP emp ~ 92% of S-corp emp ~ 80% of P emp Other C- corps Source: 2018 Business Register. *Small C-Corps = C-corps with <= 19 employees. They account for more than 50% of all C-corps and less than 15% of C-corp employment. back 20
Nonemployer Nonemployer & Employer Universe & Employer Universe Nonemployers ~ 27 million Employers ~ 6 million Sole proprietorships Partnerships Sole proprietorships Partnerships S-corporations C-corporations Other S-corporations C-corporations 5% 2% 7% 14% 15% 7% 12% 87% 52% Source: 2020 Business Register 21 Other: Governments, non-profits.
Employer Identification Number or EIN Employer Identification Number or EIN An Employer Identification Number or EIN is a unique nine-digit number that identifies your business for tax purposes Required for all employer firms Different uses such as payroll or income reporting to IRS A given EIN may be used for both payroll and income tax purposes Most employer businesses have 1 EIN 22
Illustration Illustration - - 2018 Hybrid 2018 Hybrid- -data Total Business Demographics data Total Business Demographics A higher share of female-owned firms are nonemployers Black-female firms are overwhelmingly nonemployers FEMALE-NHPI 10.5% 89.5% FEMALE OWNED 9.5% 90.5% FEMALE-ASIAN 15.0% 85.0% FEMALE-AIAN 18.3% 81.7% FEMALE-BLACK 2.6% 97.4% MALE OWNED 19.6% 80.4% FEMALE-WHITE 10.2% 89.8% Employer firms Nonemployer firms Employers firms Nonemployers firms Sources: 2018 NES-D and 2019 ABS (2018 reference year) 23


")
")