Enhancing Financial Transparency in Education: Lessons Learned from ESEA Conference
Explore key insights from the 2019 National ESEA Conference focusing on financial transparency in education. Understand the importance of tools like FTRRA and per-pupil expenditure data for informed decision-making in resource allocation discussions at school and district levels.

Download Presentation

Please find below an Image/Link to download the presentation.
The content on the website is provided AS IS for your information and personal use only. It may not be sold, licensed, or shared on other websites without obtaining consent from the author. If you encounter any issues during the download, it is possible that the publisher has removed the file from their server.
You are allowed to download the files provided on this website for personal or commercial use, subject to the condition that they are used lawfully. All files are the property of their respective owners.
The content on the website is provided AS IS for your information and personal use only. It may not be sold, licensed, or shared on other websites without obtaining consent from the author.
E N D
Presentation Transcript
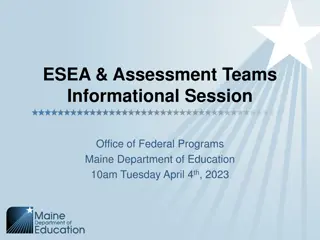
ESEA Financial Transparency Reporting: Lessons from State and District Partnerships 2019 National ESEA Conference February 2, 2019| Kansas City, MO
TECHNOLOGY CHECK PLEASE MAKE SURE YOU ARE READY TO ENGAGE IN OUR PRESENTATION! Poll Everywhere 1. Navigate to our Poll Everywhere URL on your preferred device: www.pollev.com/ssnetwork 2. Complete our quick survey about school-level resource allocation while you wait for our session to begin!
OBJECTIVES As a result of this session, participants will: Understand how the Financial Transparency and Readiness Reporting Assessment (FTRRA) tool can be used to display school- and district-level financial transparency data; Identify key questions that stakeholders may ask regarding per-pupil expenditures; and Share how the FTRRA tool can help local education agencies (LEAs) use financial transparency data to inform ongoing resource allocation conversations and decisions.
AGENDA Per-pupil Expenditure Requirements in the Elementary Secondary Act (ESEA) 1. FTRRA Tool 2. Table Activity with FTRRA Tool 3. Informing Resource Allocation Conversations and Decisions 4. Additional Resources 5. Questions 6.
PRESENTERS Aaron Butler, State Support Network Renee Sullivan, Education Resource Strategies Gayellyn Jacobson, Beaverton School District Michael Wiltfong, Oregon Department of Education
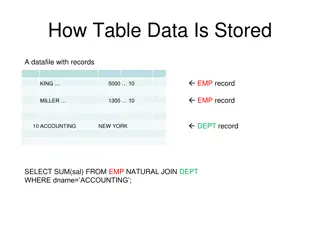
PER-PUPIL SPENDING WITHIN A DISTRICT THIS SPENDING CAN VARY WIDELY WITHIN A DISTRICT, WHICH MAKES IT HARD FOR STAKEHOLDERS TO KNOW IF INDIVIDUAL SCHOOLS ARE OVER- OR UNDER-FUNDED $16,000 $14,000 School Reported Per Pupil Spending $12,000 $10,000 $8,000 $6,000 $4,000 $2,000 $0 District High Schools Low High Percent Free and Reduced-Price Lunch
Per-pupil Expenditure Requirements in the ESEA
PER-PUPIL EXPENDITURES A state and its LEAs must annually report per-pupil expenditures of federal, state, and local funds on SEA and LEA report cards, disaggregated by source of funds. Per-pupil expenditures must include actual personnel and non-personnel expenditures. A state and its LEAs must report per-pupil expenditures for the LEA as a whole and for each school served by the LEA for the preceding fiscal year. ESEA 1111(h)(1)(C)(x), (h)(2)(C)
PER-PUPIL EXPENDITURES REPORTING TIMELINE As stated in the June 28, 2017, Dear Colleague letter, the U.S. Department of Education (ED) is giving states and LEAs until the 2018-19 school year to report on annual report cards regarding per-pupil expenditures, as described on the previous slide. If an SEA elects to delay reporting on the 2017-18 report cards, the SEA and its LEAs must provide a brief description of the steps the SEA and LEAs are taking to ensure that information on the per-pupil expenditures will be included beginning with report cards for the 2018-19 school year.
APPROACH PER-PUPIL EXPENDITURE REPORTING 1. Report accurately Calculate expenditures (once you have the data) in a complete and accurate way that is not overly burdensome 2. Communicate Determine how to report publicly and how to support districts with stakeholder engagement Make meaning of the expenditures 3. Expand Put the expenditures in context of overall non-financial resource use and equity across schools
SUPPORT FOR OREGON PROJECT GOALS 1. Districts will be able to validate the quality of financial transparency data to ensure accurate reporting of per-pupil expenditure data for each school while using the Financial Transparency and Reporting Readiness Assessment (FTRRA) Tool and analyze the equitable distribution of non-financial resources. (Phase 1 spring 2018) Districts will be able to clearly communicate the reasons for resource variation across their schools (financial and non-financial) to internal and external stakeholders. (Phase 2 summer 2018) 2. The Oregon Department of Education (ODE) will be able to identify trends and patterns in financial transparency data to inform their approach to calculating and reporting school-level per-pupil expenditures. (Phase 2 summer 2018) 3. ODE will be able to clearly define and articulate its approach to meeting the ESEA s financial transparency requirement. (Phase 3 fall 2018) 4.
FTRRA TOOL STATESUPPORTNETWORK.ED.GOV Access the tool at https://statesupportnetwork.ed.gov/resources/financial- transparency-and-reporting-readiness-assessment-tool
PRIMARY USES FOR THE FTRRA TOOL 1. For SEAs: To see the impact of various methodology decisions on an individual district s data to inform your approach (if you choose to specify a $ per-pupil calculation methodology) Inform the types of technical assistance you or your districts may need related to methodology decisions 2. For LEAs: To examine current accounting practices and structures to inform improvements to your own systems Inform future revisions to your SEA s methodology decisions
FTRRA TOOL COMPONENTS OF THE TOOL 1. Self-Diagnostic Can be completed without loading financial data Financial Data and Schools Data Input a districts data in these tabs Requires light coding of financial data to identify exclusions, school locations, and billed to school vs centrally Exclusions & Expense Level Type Requires financial data Report summarizing financial coding decisions Attribution Rules & Schools Requires financial and school data Identify (mis)alignment of enrollment and expenditures locations Select attribution rules to distribute centrally held expenditures to schools See fully attributed per pupil expenditures across schools 2. 3. 4.
FTRRA TOOL SELF-DIAGNOSTIC 1 2 3 4
FTRRA TOOL EXCLUSIONS AND EXPENSE LEVEL TYPE (SCHOOL OR DISTRICT REPORTED)
FTRRA TOOL ATTRIBUTION RULES AND SCHOOLS
TABLE ACTIVITY $ PER-PUPIL REPORT SAMPLE SCHOOL DISTRICT District Median = $ 9,820 Attributed Dollars Per Pupil (Centrally Managed School Services) Total Attributed Dollars Per Pupil (Central + Centrally Managed School Services) Total (Fully Attributed) Dollars Per Pupil Location Designation Location Description School-Accounted Dollars Per Pupil Attributed Dollars Per Pupil (Central) 965 School-204 $ 39,552 $ 1,897 $ 2,321 $ 4,218 $ 43,770 951 School-203 $ 49,382 $ 1,901 $ 2,335 $ 4,236 $ 53,618 916 School-202 $ 42,766 $ 1,901 $ 2,335 $ 4,236 $ 47,002 823 School-201 $ 7,937 $ 1,374 $ 443 $ 1,817 $ 9,754 822 School-200 $ 8,563 $ 1,394 $ 515 $ 1,909 $ 10,472 820 School-199 $ 9,096 $ 1,395 $ 521 $ 1,916 $ 11,012 819 School-198 $ 11,291 $ 1,448 $ 708 $ 2,156 $ 13,447 818 School-197 $ 10,388 $ 1,399 $ 532 $ 1,931 $ 12,319 817 School-196 $ 8,425 $ 1,384 $ 477 $ 1,861 $ 10,286 815 School-195 $ 9,472 $ 1,402 $ 543 $ 1,946 $ 11,418
STAKEHOLDER PERSPECTIVES WHAT FOLLOW-UP QUESTIONS WOULD A STAKEHOLDER ASK IF PROVIDED THIS TYPE OF PER-PUPIL EXPENDITURE AMOUNT AT EACH SCHOOL? WHY? 1. Assign a different role for each person at your table SEA staff, parent, principal, teacher, school board member, or community member. 2. Each person writes 1-2 questions that someone in that role may ask about the reported per-pupil expenditure amount at a school board meeting, on social media, etc. 3. Share your questions across roles at your table group. 4. Discuss how the school, district, and state can or should collaborate to answer these types of questions. 5. How might these types of conversations affect you and/or your state?
Informing Resource Allocation Conversations and Decisions
TYPICAL DRIVERS OF SCHOOL SPENDING VARIATION Unplanned Enrollment/ School Size $$$ Building Utilization $ Teacher Compensation $ Enrollment Projections $ Ad-Hoc Exceptions $ Student Need Special Education $$$ English Learners $$ Economic Disadvantage $$ District Strategy School Level $ School Type $ School Opening/ Closure Transition Cost $ Other Student Needs $
DIMENSIONS OF RESOURCE EQUITY Resource equity places student experience at the center and explores the ways in which resources are allocated and used. The dimensions included here represent resources that school system leaders can directly control through policy or practice.
DISPLAYING NON-FINANCIAL DATA ALONGSIDE FINANCIAL $ PER-PUPIL REPORT, INCLUDING STUDENT DEMOGRAPHICS AND DIMENSIONS OF RESOURCE EQUITY SAMPLE SCHOOL DISTRICT Examples of Dimensions of Res. Eq. Primary Drivers of Spending Variation % Free and Reduced- Price Lunch Location Descr. (Elementar y) Total (Fully Attributed) $ Per Pupil % Students with Disabilities % English Language Learners % Highly Effective Teachers % Teachers in their first 0-3 years Principal Experience (years) Total Enrollment 98 95% 12% 48% 13% 18% 3.0 Sch-204 $ 43,770 82 95% 15% 61% 14% 21% 5.0 Sch-203 $ 53,618 364 8% 10% 37% 10% 13% 8.5 Sch-201 $ 9,754 298 13% 11% 85% 7% 20% 1.0 Sch-200 $ 10,472 251 8% 12% 45% 20% 8% 4.5 Sch-198 $ 13,447 408 12% 23% 75% 17% 10% 1.5 Sch-197 $ 12,319 Dist Avg. $ 9,820 325 Yellow = Expect to drive higher spending 10%* 10% 50% 15% 13% 4.8 Data notes: Data is not representative of any one district. * Average % Students with Disabilities, excluding outlier Special Education schools.
DISPLAYING NON-FINANCIAL DATA ALONGSIDE FINANCIAL $ PER-PUPIL REPORT, INCLUDING STUDENT DEMOGRAPHICS AND DIMENSIONS OF RESOURCE EQUITY SAMPLE SCHOOL DISTRICT Examples of Dimensions of Res. Eq. Primary Drivers of Spending Variation % Free and Reduced- Price Lunch Location Descr. (Elementar y) Total (Fully Attributed) $ Per Pupil % Students with Disabilities % English Language Learners % Highly Effective Teachers % Teachers in their first 0-3 years Principal Experience (years) Total Enrollment 98 95% 12% 48% 13% 18% 3.0 Sch-204 $ 43,770 82 95% 15% 61% 14% 21% 5.0 Sch-203 $ 53,618 364 8% 10% 37% 10% 13% 8.5 Sch-201 $ 9,754 298 13% 11% 85% 7% 20% 1.0 Sch-200 $ 10,472 251 8% 12% 45% 20% 8% 4.5 Sch-198 $ 13,447 408 12% 23% 75% 17% 10% 1.5 Sch-197 $ 12,319 Dist Avg. $ 9,820 325 Yellow = Expect to drive higher spending 10%* 10% 50% 15% 13% 4.8 Data notes: Data is not representative of any one district. * Average % Students with Disabilities, excluding outlier Special Education schools.
DISPLAYING NON-FINANCIAL DATA ALONGSIDE FINANCIAL $ PER-PUPIL REPORT, INCLUDING STUDENT DEMOGRAPHICS AND DIMENSIONS OF RESOURCE EQUITY SAMPLE SCHOOL DISTRICT Examples of Dimensions of Res. Eq. Primary Drivers of Spending Variation % Free and Reduced- Price Lunch Location Descr. (Elementar y) Total (Fully Attributed) $ Per Pupil % Students with Disabilities % English Language Learners % Highly Effective Teachers % Teachers in their first 0-3 years Principal Experience (years) Total Enrollment 98 95% 12% 48% 13% 18% 3.0 Sch-204 $ 43,770 82 95% 15% 61% 14% 21% 5.0 Sch-203 $ 53,618 364 8% 10% 37% 10% 13% 8.5 Sch-201 $ 9,754 298 13% 11% 85% 7% 20% 1.0 Sch-200 $ 10,472 251 8% 12% 45% 20% 8% 4.5 Sch-198 $ 13,447 408 12% 23% 75% 17% 10% 1.5 Sch-197 $ 12,319 Dist Avg. $ 9,820 325 Yellow = Expect to drive higher spending 10%* 10% 50% 15% 13% 4.8 Data notes: Data is not representative of any one district. * Average % Students with Disabilities, excluding outlier Special Education schools.
DISPLAYING NON-FINANCIAL DATA ALONGSIDE FINANCIAL $ PER-PUPIL REPORT, INCLUDING STUDENT DEMOGRAPHICS AND DIMENSIONS OF RESOURCE EQUITY SAMPLE SCHOOL DISTRICT Examples of Dimensions of Res. Eq. Primary Drivers of Spending Variation % Free and Reduced- Price Lunch Location Descr. (Elementar y) Total (Fully Attributed) $ Per Pupil % Students with Disabilities % English Language Learners % Highly Effective Teachers % Teachers in their first 0-3 years Principal Experience (years) Total Enrollment 98 95% 12% 48% 13% 18% 3.0 Sch-204 $ 43,770 82 95% 15% 61% 14% 21% 5.0 Sch-203 $ 53,618 364 8% 10% 37% 10% 13% 8.5 Sch-201 $ 9,754 298 13% 11% 85% 7% 20% 1.0 Sch-200 $ 10,472 251 8% 12% 45% 20% 8% 4.5 Sch-198 $ 13,447 408 12% 23% 75% 17% 10% 1.5 Sch-197 $ 12,319 Dist Avg. $ 9,820 325 Yellow = Expect to drive higher spending 10%* 10% 50% 15% 13% 4.8 Data notes: Data is not representative of any one district. * Average % Students with Disabilities, excluding outlier Special Education schools.
DISPLAYING NON-FINANCIAL DATA ALONGSIDE FINANCIAL $ PER-PUPIL REPORT, INCLUDING STUDENT DEMOGRAPHICS AND DIMENSIONS OF RESOURCE EQUITY SAMPLE SCHOOL DISTRICT Examples of Dimensions of Res. Eq. Primary Drivers of Spending Variation % Free and Reduced- Price Lunch 48% Location Descr. (Elementar y) Sch-204 Total (Fully Attributed) $ Per Pupil $ 43,770 % Students with Disabilities 95% % English Language Learners 12% % Highly Effective Teachers 13% % Teachers in their first 0-3 years 18% Principal Experience (years) 3.0 Total Enrollment 98 82 95% 15% 61% 14% 21% 5.0 Sch-203 $ 53,618 364 8% 10% 37% 10% 13% 8.5 Sch-201 $ 9,754 298 13% 11% 85% 7% 20% 1.0 Sch-200 $ 10,472 251 8% 12% 45% 20% 8% 4.5 Sch-198 $ 13,447 408 12% 23% 75% 17% 10% 1.5 Sch-197 $ 12,319 Dist Avg. $ 9,820 325 Yellow = Expect to drive higher spending 10%* 10% 50% 15% Blue = Generally less favorable 13% 4.8 Data notes: Data is not representative of any one district. * Average % Students with Disabilities, excluding outlier Special Education schools.
ADDITIONAL RESOURCES State Support Network Financial Transparency and Reporting Readiness Assessment Tool (FTRRA) Building State Capacity and Productivity Center - Checklist to Guide Data- Visualization Decisions Chiefs for Change Policy Paper From Financial Transparency to Equity: Part 1 Education Resource Strategies Paper What is Resource Equity? Edunomics Lab Research Report Interstate Financial Reporting Department of Education Letter on Per-Pupil Expenditures
STATE SUPPORT NETWORK CONTACT US TO REQUEST TECHNICAL ASSISTANCE State Support Network https://statesupportnetwork.ed.gov/technical-assistance Complete the online form to request technical assistance Aaron Butler Individualized Technical Assistance Lead Phone: 314.917.6657 Email: abutler@air.org