Enhancing Skills Training Programs: Comparative Analysis of MES and PMKVY
This research delves into the impact of short-term training programs such as MES and PMKVY on participant performance and outcomes. By comparing these initiatives and analyzing factors influencing returns from training, the study sheds light on the importance of exposure, network effects, and institutional support in determining training effectiveness. Through a causal framework and econometric models, the research explores the implications of policy changes and institutional shifts on the success of training programs.

Download Presentation

Please find below an Image/Link to download the presentation.
The content on the website is provided AS IS for your information and personal use only. It may not be sold, licensed, or shared on other websites without obtaining consent from the author. If you encounter any issues during the download, it is possible that the publisher has removed the file from their server.
You are allowed to download the files provided on this website for personal or commercial use, subject to the condition that they are used lawfully. All files are the property of their respective owners.
The content on the website is provided AS IS for your information and personal use only. It may not be sold, licensed, or shared on other websites without obtaining consent from the author.
E N D
Presentation Transcript
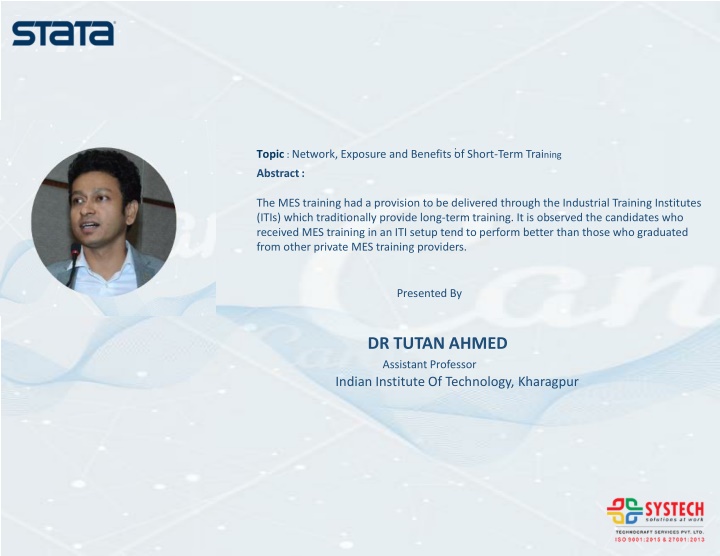
: Topic: Network, Exposure and Benefits of Short-Term Training Abstract : The MES training had a provision to be delivered through the Industrial Training Institutes (ITIs) which traditionally provide long-term training. It is observed the candidates who received MES training in an ITI setup tend to perform better than those who graduated from other private MES training providers. Presented By DR TUTAN AHMED Assistant Professor Indian Institute Of Technology, Kharagpur
Institution, Exposure and Returns from short term training:ACausal analysis TutanAhmed IITKharagpur 30thNovember 2023 Stata India Conference 2
Presentation Plan Slide 4: Background, Research Question, Data, Research Method, Summary of the Findings Slide 5-6: Factors affecting returns from training Slide 7-8: Setting the Context [ Modular Employability Scheme and PMKVY] Slide 9-13: Data Sources [ Modular Employability Scheme and PMKVY] Slide 14-23: Understanding the Selection Rules and Institutional variations to these Training Programs Slide 24: Econometric Model and Propensity Score Method Slides 25-28: Descriptive Statistics Slides 29-37: DID Estimation Framework Slides 38-40: DID Estimation Results Slide 41: Results and Interpretation 3
Research Summary Compared two almost similar training programs (MES and PMKVY) discontinuation of MES was necessitated after introduction of a similar short term training program PMKVY These two policies targeted the same beneficiaries while some institutional shifts were unavoidable These policy change and the institutional shifts are exploited with a causal framework to explain the role of - exposure, duration of short term of training, effect of network, effect of institutional supports, importance of long term training etc. on the returns to training Data from two recall surveys are analyzed using propensity score and DID method 5
Brief Literature on factors influencing returns from training Usually long term training is more beneficial than the short term training (Singh, Yadav & Pradhan, 2023) It seems that these training programs have a life. The benefits from the short term training is to be reaped without a certain time frame (Chakravorty & Bedi, 2019) Same is applicable for the long term training. For long term training, no immediate benefit is discernible. However, benefits could be reaped after a couple of years. Lechner et al. (2011), based on an analysis of training programs in Germany, showed employment probability to be positive and significant (10 to 20 percentage points more) as compared to non-trainees even after eight years of training completion 6
Brief Literature on factors influencing returns from training Role of skill development and returns from training (Mensch et al, 2004, Maitra and Mani, 2017) Sustainability of the benefits of such training programs (Alfonsi et al. (2020), Honorati (2015)) vs (Acevedo et al, 2017; Azula et al, 2016; Hirshleifer et al, 2016; Chakravorty and Bedi, 2019). Sustainability of the benefit for females (Ibarraran et al., 2019; Attanasio et al., 2017). Network job market information (Jensen, 2012, Chakravorty et al, 2022) 7
Similarity between Modular Employability Scheme (MES) & PMKVY An elaboration of the institutional change PMKVY scheme came as a replacement of the MES scheme whereas the guidelines of PMKVYwas formulated from the learnings of MES Both the training programs were flagship short term training program The role of National Skill DevelopmentAgency (NSDA) in the above guideline development and scheme transformation Curriculum and the process of development of curriculum DGET ecosystem and NDSC/ NSDAecosystem Entry criteria, fees structure Small additional placement incentives for both the programs 8
Similarity between Modular Employability Scheme (MES) & PMKVY Types of training [particularly in the context of Delhi] Role of National Skill Qualification Framework and the movement towards standardization of the training programs Selection of the training providers for these two programs Selection of theAssessmentAgencies for these two programs Both training programs focused on NSQF level 4 or below [demonstration of the course mapping] Duration of the courses a major difference Institutional mode of delivery: PMKVY-N, PMKVY-I, MES-ITI, MES-Pvt. (other left out categories) 9
Source of Data SDIS (Skill Development Initiative System) - Database contains details of more than a million students since 2011 (date of access 6thOctober 2015) - Accessed Data: For Delhi, 26607 candidates including phone numbers [ accessed from the Profile module of the database ], 90,000+ Vocational training provider (VTP) data, more than 1 million enrolment data. Placement summary details were accessed separately SDMS (Skill Development Management System) - Database contains details of 3 million students since 2013 that includes STAR scheme, PMKVY and Non- PMKVYtraining data (date of access 23rd January, 2016) - Accessed Data: 3 million candidate data including basic details and phone number [accessed from Candidate module of PMKVY database]. Training center, course, placement summary details were accessed separately Adigression: NSQF and Central Data Coordination and Monitoring through SDMS [Ministry and Department Data] 1 0
Sample Selection for the multi-period Recall Survey for PMKVY SDMS Database: SDMS collated 2.4 million data in 2015-2016, actual PMKVY and non-PMKVY training done through NSDC was close to .73 million. Delhi, PMKVY and non-PMKVY enrolment figure was 47348 and certified candidates were 33999. Enrolment in PMKVY alone was 31,253 NSDC conducted both training and certification (PMKVY) and only certification (non-PMKVY) through its SSCs and Training Partners No of Training Partners 178 and the number of independent Training Centers 406 No of Training Partners with extended network (PMKVY N): 197 and Number of Independent Training Centers without an extended Network (PMKVY I): 387 10
Sample Selection for the multi-period Recall Survey for PMKVY SDMS Database: Every third phone number from the SDMS database was contacted during June 2019 to November 2019 [10418] 21% data duplication [7007] The desired age group of 19-22 [3776] 64% of the candidates called didn t pick up the call/switched off/invalid number [1202] 25% phone picked up by family/friend/ someone known and 4% didn t ever receive PMKVYtraining and 43% not interested to participate in the survey [256] 105 Candidates from PMKVY-N and 151 candidates from PMKVY-I 11
Sample Selection for the multi-period Recall Survey for MES SDIS Database Data is maintained only from 2011. A total of above one million data was stored at the time of access to the database All training centers were required to update the data on the platform. Aadhar based enrolment wasn t mandatory Types of Training Provides in MES Scheme in Delhi. Total number of training providers including all these categories MES in private/ government ITI Setup (23%) through formation of InstituteManagement Committee (IMC) MES training conducted by the private Vocational Training Providers (VTPs) in standalone training centers (68%) MES training conducted by the employers (9%) 12
Sample Selection for the multi-period Recall Survey for MES SDIS Database Atotal of 26607 candidates enrolled in MES in 2014-2015 in Delhi Every third phone number from the SDIS database was contacted during August 2018 to December 2018 [8869] 17% data duplication [7007] The desired age group of 19-22 [2803] 67% of the candidates called didn t pick up the call/switched off/invalid number [925] Of the remaining, 35% phone picked up by family/friend/ someone known/ Unknown and 5% didn t ever receive MES training and 34% not interested to participate in the survey [241] 148 Candidates from MES-Private and 93 candidates from MES-ITI 13
Skewness Plot for PMKVYAge 1. Such differences in age distribution -- a) PMKVY no college students to be admitted b) PMKVY short term (very) allowed. Which made PMKVY a relatively easy to experiment c) PMKVY advertisement A huge budget with 15
Major Challenge in theApplication of the DID Method: Asufficient condition for identification is that selection for treatment does not depend on the individual-transitory shocks Ashenfelter s Dip: A period of uncertainty, exploration and search. This period is characterized by a temporary decline in real wages, followed by an upward trajectory as workers gain experience, skills, and seniority. -- Selection of theAge Group Another level of data complexity: If the candidates have received further higher education it is quite likely they would take further higher education (see: School Resources and Student Outcomes:An Overview of the Literature and New Evidence from North and South Carolina David Card andAlan B. Krueger, 1996) -- Capturing Career Transition post the training 16
Selection of Control Group Slightly different structure of capturing data in these two programs a) data on rolling/ waitlisted candidates in MES (possibility of use of oversubscription method) b) b) data on dropout candidates in PMKVY (possibility of use of dropouts as a comparison group) College students entry in PMKVYvs MES training Use of friendship network : friend who showed some interest as control group Violation of SUTVA: conditions for identification of control units using loosely connected friend Total Control Group Sample: MES 73, PMKVY 87 17
Self-Selection into Training Programs Reason for Selection of Training Center MES PMKVY Nearness to Home 64% 71% FormAdvertisement 5% 13% Referral from a Friend 12% 6% Referral from relative/school/ community 13% 7% Compared Centers based on Reputation 4% 2% Any Other 2% 1% 18
Motivations for joining into the Training Programs Motivations for Selection of Training MES PMKVY Use the training as a stepping stone for career Use the training/certificate as additional career avenue Learning a new skill, not so much to use it as career option No particular work at hand so getting a certification Friends have joined so I followed with no career interest in mind 47% 42% 25% 14% 12% 19% 8% 13% 6% 8% Any Other 2% 4% 19
PMKVYEnrolment Distribution PMKVY - Candidates Trained in Delhi (2015-2016) 12000 10000 8000 6000 4000 2000 0 20
PMKVYEnrolment Distribution PMKVY 2015-2016 (Delhi): Candidates Directly Trained & Certified by NSDC 4500 4000 4174 3500 3000 2500 2000 2180 2160 2055 1500 1823 1553 1502 1410 1343 124011421074 1000 988 500 689 347 292 236 221 0 21
MES Enrolment Distribution MES Enrolment Distribution in Delhi in 2014-2015 5000 4500 4000 3500 3000 2500 2000 1500 1000 500 0 Beauty & Wellness Telecom IT & ITeS Retail Apparel Media Construction Electronics Healthcare Fabrication 22
Similarities and Dissimilarities of these two Training Programs: Course Specific Heterogeneity TrainingSector Automobile Retail Security Logistics Electronics Beautician Gems and Jewelry Healthcare Telecom Tourism IT & ITeS BFSI Media & Entertainment Construction Apparel Duration for MES 222.1 165 126 172 200.5 184 234 276 110 102 145 152 125 162 170 Duration for PMKVY 35 28 27 42 38 32 58 64 26 29 35 34 48 42 31 Demonstrationof CouseMappingBetweenthesetwoPrograms 23
Estimation Strategy E(Y|T= ITI-MES) E(Y|T=MES-PVT) = Effect of MES training in ITI infrastructure (i) E(Y|T= ITI-MES) E(Y|T=0) = Effect of MES training in ITI infrastructure + Effect of Short Term Training (ii) E(Y|T=TMES PVT) E(Y|T=0) = Effect of Short Term Training (iii) E(Y|T=PMKVY-N) E(Y|T=PMKVY-I) = Effect of PMKVYtraining with Infrastructure (iv) E(Y|T= PMKVY-N) E(Y|T=0) = Effect of PMKVYtraining with Infrastructure+ Effect of Short Term training (v) E(Y|T= PMKVY-I) E(Y|T=0) = Effect of Short Term training (vi) 24
Descriptive Statistics for PMKVY and MES PMKVY MES Average Salary 106782 19076.54 114913 St Dev 17036.86 265000 Max 240000 42000 Min 48000 2234 Total Placed 1985 6.24 8.63 Percentage Employed CCE (18%), Drivers (8%), Reception/Back office (9%), BPO (21%), Security (14%), Healthcare (5%), Computer Operator (14%), DEO (10%) DEO (27%), CCE (22%), Reception (5%), Tele caller (9%), Teleservice Officer (3%), Security (4%) (25%), Computer Operator Major Job Roles for Salaried Employment Source: MES unit level data on employment, PMKVY employment data from RTI (above details were25 captured within six months of training)
Income Difference for the Combined Treatment and Control Groups 26
Income Difference for the four different Treatment Groups 27
Descriptive Statistics on Short/ Long Term Training Pre & Post Intervention Training Program Prior Long Term Training Posterior Long TermTraining PriorShort TermTraining Posterior Short TermTraining MES-ITI 24% 39% 3% 11% MES-Pvt 1.5% 8% 5% 18% MES-Control 2% 11% 1.5% 12% PMKVY-Partner 2% 9% 4% 8% PMKVY-Pvt 3% 6% 2% 5% PMKVY-Control 1% 10% 1% 11% 28
Econometric Method A combined application of Propensity Score Match using MDM method (King, 2015) and DID estimation method (Stuart et al, 2014) PSM deals with the existing selection bias problem whereas DID is useful to address the time related confounders and unobserved heterogeneity Improved precision of result as PSM creates a more comparable treatment and control groups Robustness check with common support assumption and parallel trend assumptions Improved validity of causal inference 29
Choice of the Matching Technique NN: matching is simply a match between the closest P-Score between the treatment and the control group. No consideration for covariates and only scaler value matching Caliper: It is similar to NN matching whereas an acceptable distance criteria parameter is also included Kernel Density considers the entire distribution of the propensity scores. Therefore, matching is done considering the estimated densities than just p- score. Difficult to apply for small sample MDM: Is a relatively better approach as it looks into the covariate structure and not just the propensity score. In a sense, it takes into account the vector component while performing the sample pruning exercise. MDM could be robust to multicollinearity and less sensitive to outliers 30
Choice of the Matching Technique MDM tends to be more robust to multicollinearity and outliers compared to nearest neighbor matching. The p-score and the distance then multiplied to perform the matching operations. Di=[(Xi X ) S-1(Xi X )]1/2 Then, the p-score and the distance are combined together to perform the matching. Usually, the common way of combining the two measurements is as follows Match Score =w Di+ (1 w) Pi 1 31
Covariate Balancing with Propensity Score Method using Mahalanobis Distance Model (MDM) for MES-Pvt and MES Control Group Training Coef. Std. Err. z P>z [95% Conf. Interval] PriorWF_N .2897652 Prior_E PriorScore -.0061752 Pr_LongTg .046649 PriorSt_Trg -.3663379 Muslim Age_trg BPL RELG_OT -.517418 OBC SC ST Marital _cons .2108213 .0541668 .0080319 .3015309 .2222392 .2146057 .0503403 .2731212 .4213821 .2992999 .3577788 .2931808 .3208898 1.195365 1.37 0.30 -0.77 0.15 -1.65 2.32 -0.13 0.46 -1.23 2.00 2.15 0.29 -0.10 0.18 0.169 0.764 0.442 0.877 0.099 0.020 0.900 0.648 0.219 0.045 0.031 0.775 0.918 0.861 -.1234369 -.0898804 -.0219174 -.5443407 -.8019186 .0777649 -.104976 -.4104293 -1.343312 .0133723 .0692704 -.4907339 -.6621489 -2.132806 .7029673 .1224496 .0095669 .6376386 .0692429 .9190038 .0923543 .6601862 .3084757 1.186606 1.471737 .6585137 .595716 2.552939 .0162846 .4983844 -.0063108 .1248784 .5999893 .7705039 .0838899 -.0332164 .2100665 32
Covariate Balancing with Propensity Score Method using Mahalanobis Distance Model (MDM) for MES-Pvt and MES Control Group psmatch2: Treatment assignment psmatch2: Common support Off support On support Total Untreated0 Treated 73 73 25 132 157 Total 25 205 230 Same Matching Process is used for the remaining other three treatment groups 33
Difference-in-Difference Framework Diff-in-Diff in a regression framework: .(i) Y= 0+ 1E+ 2T+ 3E*T+ u Where, 1is the initial difference (marginal difference of D atT=0 And 2is the baseline change overti T me Whereas, 3is the treatmenteffect. 34
Difference-in-Difference Framework In its basic form, the DD model relies on an assumption that in the absence of the program or policy of interest, the treatment and comparison groups would have had the same trends across time. Importance of validation of parallel trend assumption Y= 0+ 1E+ 2T + 3E*T+ 4[Covariates] + 5E*[Pre-T]+ u .(ii) 35
Difference-in-Difference Framework for MES Training Year MES Training Govt Setup YPre(i, MES-GOV =0) MES Training Pvt Setup YPre(i, MES-PVT =0) MES Training Control YPre(i, MES-C) 2014-2015 2015-2016 2016-2017 2017-2018 YPost(i, MES-GOV =1) YPost(i, MES-PVT =1) YPost(i, MES-C) 2018-2019 2019-2020 [YPost MES-GOV =0)] - [ YPosti, MES-C)- YPre(i, MES-C)] - YPre [YPost MES-PVT =0)] - [ YPosti, MES-C) - YPre(i, MES-C)] - YPre (i, MES-GOV =1) (i, (i, MES-PVT =1) (i, ( ( Difference Income, Salaried Work, Further Long Term Training Y Variables 36
Difference-in-Difference Framework for PMKVYTraining PMKVY Training Control PMKVY Extended Network Training Setup PMKVY Independent Single Training Setup Year 2014-2015 2015-2016 2016-2017 2017-2018 2018-2019 2019-2020 YPre(i,PMKVY-N = 0) YPre(i,KVY-I = 0) YPre(i,KVY-C) YPost(i, PMKVY-N= 1) [YPost (i, PMKVY-N =1) - [ YPost (i, KVY-C) Income, Salaried Work, Further Long Term Training YPost(i, KVY-I = 1) [YPost (i, KVY-I =1) YPost (i, KVY-C) YPost(i, KVY-C) - YPre - YPre ] - YPre - YPre ] - [ (i, PMKVY-N =0) ] (i, KVY-C) (i, KVY-I=0) ] (i, KVY-C) Difference Y Variables 37
DID Coefficients for Salaried Employment Coefficient Robust std. err. .043 t P>|t| 95% Conf. Interval .73435 .92342 ATET (MES at ITI) ATET (MES at Pvt.) ATET (PMKVY-N) ATET (PMKVY-I) ATET (PMKVY-P) ATET (PMKVY- NP) .73 21.2 0.00 .29 .21 1.37 .21 -.123 .702 .62 .311 2.00 .048 .012 1.13 .13 .27 .46 .648 -.241 .876 .30 .08 3.75 .022 .2876 .3425 .77 .35 2.15 .03 .069 1.472 38
DID Coefficients for Further Long Term Training Coefficient Robust std. err. t P>|t| 95% Conf. Interval .0778 .919 ATET (MES at ITI) ATET (MES at Pvt) .4983844 .2146057 2.32 0.020 .0162846 .0541668 0.30 0.764 -.089 .122 ATET(PMKVY- N) .046649 .3015309 0.15 0.877 -.544 .637 ATET(PMKVY- I) -.517418 .4213821 -1.23 0.219 -1.343 .308 ATET(PMKVY- P) .0838899 .2931808 0.29 0.775 -.497 .658 ATET(PMKVY- NP) -.0332164 .3208898 -0.10 0.918 -.662 .595 39
DID Coefficients for Wage/ Salary Coefficient Robust std. err. t P>|t| 95% Conf. Interval 279.87 ATET (MES at ITI) ATET (MES at pvt.) ATET (PMKVY-N) ATET (PMKVY-I) ATET (PMKVY-P) ATET (PMKVY-NP) 882.9192 305.8812 2.89 0.004 1485.96 264.3605 144.6765 1.83 0.069 -20.86 549.58 346.4935 185.6719 1.87 0.063 -19.55 712.54 179.2276 131.0645 1.37 0.173 -79.16 437.62 161.9935 33.85294 4.79 0.000 95.252 228.734 248.2733 288.7556 0.86 0.391 321.01 817.55 40
Results & Interpretation The exposure effect of the MES-ITI is quite prominent. A significant correlation could be observed between placement support received after the short- term training and the present earnings. Duration of the training matters to some extent Extended network of training setup (PMKVY-N)has some positive impact. The positive impact sustains even when controlled for the placement setup Lion s share of training and employment is in Services or Utility sector. Hardly any training or employment in manufacturing sector Not much variation in the NSQF levels - almost all courses are either level 3 or level 4 Take up of the future courses more likely for MES-Govt and from the control group Long term trainings have a distinct impact on salaried employment/ wage/salary vis- -vis the short term training 41
ThankYou! Questions? 42


")
")