Enhancing Subject Leadership with Dashboard Charts
Explore how dashboard charts in Blippit Boards can empower subject leaders to analyze and enhance the science curriculum across all school levels. Dive deeper into evidence-based insights, track progress by year group, and make informed decisions for effective action plans.

Uploaded on | 1 Views
Download Presentation

Please find below an Image/Link to download the presentation.
The content on the website is provided AS IS for your information and personal use only. It may not be sold, licensed, or shared on other websites without obtaining consent from the author. If you encounter any issues during the download, it is possible that the publisher has removed the file from their server.
You are allowed to download the files provided on this website for personal or commercial use, subject to the condition that they are used lawfully. All files are the property of their respective owners.
The content on the website is provided AS IS for your information and personal use only. It may not be sold, licensed, or shared on other websites without obtaining consent from the author.
E N D
Presentation Transcript
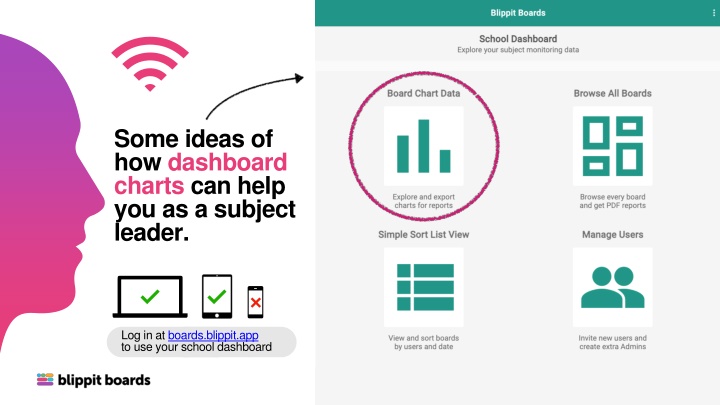
Some ideas of how dashboard charts can help you as a subject leader. Log in at boards.blippit.app to use your school dashboard blippitboards_diocese_21-1.png
Blippit Boards Dashboard Board Chart Data in the web dashboard I want to see and understand the balance of evidence that we have for the science curriculum throughout school. Set a date range if needed See at a glance what the whole school has captured and tagged. Click the science chart segment to look more closely. blippitboards_diocese_21-1.png *Available Late Feb 24
Blippit Boards Dashboard Board Chart Data in the web dashboard I want to see and understand the balance of evidence that we have for the science curriculum throughout school. Set a date range if needed The different aspects of science are shown for the whole school. Click any segment to see the specific evidence for that aspect. blippitboards_diocese_21-1.png
Blippit Boards Dashboard Board Chart Data in the web dashboard How can I go deeper to see and understand the balance of science evidence that we have each year group and key stage? Set a date range if needed Tap the filter to allow for year group and key stage science filtering. With knowledge comes greater confidence and more informed next steps for action are now open to you as a subject leader. blippitboards_diocese_21-1.png
Blippit Boards Dashboard Board Chart Data in the web dashboard Tap or click a chart segment to see the work for that focus area listed so you can report on it. Set a date range if needed There s a chart that will help inform your next steps whatever your subject area when colleagues tag boards. blippitboards_diocese_21-1.png
Some ideas of how dashboard reports can help you as subject leader. Log in at boards.blippit.app to use your school dashboard blippitboards_diocese_21-1.png
Blippit Boards Dashboard Browse all Boards in the web dashboard and Match All of these tags I d like a report containing all the secure examples of teacher- assessed writing in ks 1 that we have for the year for monitoring. Set a date range if needed Tap or click to generate your report as a PDF or Word* file blippitboards_diocese_21-1.png *Available Late Feb 24
Blippit Boards Dashboard Browse all Boards in the web dashboard and Match All of these tags I d like to report on all examples of adaptive teaching in KS 2 that we have this year in any subject for my SEND monitoring. Set a date range if needed Tap or click to generate your report as a PDF or Word* file blippitboards_diocese_21-1.png *Available Late Feb 24
Blippit Boards Dashboard Browse all Boards in the web dashboard. Tap Match Any of these tags I d like to report on any examples of Eco-Schools evidence for the whole school in any subject context. Set a date range if needed Tap or click to generate your report as a PDF or Word* file blippitboards_diocese_21-1.png *Available Late Feb 24
Blippit Boards Dashboard Browse all Boards in the web dashboard. Tap Match All of these tags I d like to report on any examples of working scientifically in science for KS 1. Set a date range if needed Tap or click to generate your report as a PDF or Word* file blippitboards_diocese_21-1.png *Available Late Feb 24
Blippit Boards Dashboard Browse all Boards in the web dashboard. Tap Match All of these tags I d like to be able to support our ECT in year 4 with number functions. I need a report on what addition & subtraction and multiplication & division looks like for year 4 before we meet up. Set a date range if needed Tap or click to generate your report as a PDF or Word* file blippitboards_diocese_21-1.png *Available Late Feb 24
appicon_opt.jpg Blippit Boards for Subject Leaders blippitboards.com Includes support for evidence gathering, monitoring & reporting on Eco-Schools, Global Neighbours, Forest School, SIAMS, SMSC, Learning Outside the Classroom & more.