Enroll Visualpath’s SRE Course - SRE Online Training in Hyderabad
Join Visualpathu2019s SRE Courses Online in India and get trained by industry leaders. Our comprehensive SRE Training covers tools like Prometheus, Grafana & Datadog. Gain hands-on experience through real-time projects and expert mentoring. Flexible

Uploaded on | 1 Views
Download Presentation

Please find below an Image/Link to download the presentation.
The content on the website is provided AS IS for your information and personal use only. It may not be sold, licensed, or shared on other websites without obtaining consent from the author. If you encounter any issues during the download, it is possible that the publisher has removed the file from their server.
You are allowed to download the files provided on this website for personal or commercial use, subject to the condition that they are used lawfully. All files are the property of their respective owners.
The content on the website is provided AS IS for your information and personal use only. It may not be sold, licensed, or shared on other websites without obtaining consent from the author.
E N D
Presentation Transcript
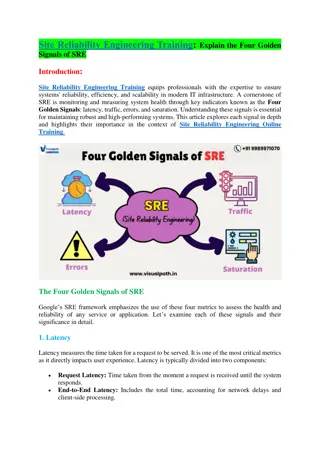
SRE Golden Signals: What to Monitor and Why (2025) Site Reliability Engineering (SRE) has evolved significantly over the years, and in 2025, it continues to be at the forefront of ensuring resilient, performant, and scalable systems. At the heart of SRE practices lie the Golden Signals a concept that simplifies the complex task of monitoring by focusing on the most critical aspects of system health. Originally popularized by Google s SRE team, the Golden Signals have stood the test of time as a foundational framework for observing distributed systems. In 2025, as organizations increasingly adopt cloud-native architectures, micro services, and AI-driven infrastructure, the Golden Signals remain essential for reducing noise, prioritizing alerts, and ensuring customer satisfaction. Site Reliability Engineering Course This article explores what the Golden Signals are, why they matter, and how they should be monitored in today s dynamic operational environments. What Are the Golden Signals? The Golden Signals are four key metrics that give a high-level yet actionable overview of system health: 1.Latency The time it takes to service a request. 2.Traffic The demand on the system, measured in requests, sessions, or data volume. 3.Errors The rate of failed requests or system faults. 4.Saturation How full the system is, typically regarding resource utilization. Each signal plays a specific role in detecting problems early and enabling effective incident response.
1. Latency: Measuring Performance Definition: Latency is the time between a user s action and the system s response. In modern systems, latency is often measured at different layers API calls, database queries, and even internal micro service interactions. It reflects how responsive the system is from the perspective of both external customers and internal services. Why It Matters in 2025: With user expectations higher than ever, even slight increases in latency can impact user experience and revenue. Additionally, latency issues often point to underlying infrastructure or architectural inefficiencies slow database queries, overloaded services, or network bottlenecks. SRE Online Training Institute Best Practices: Measure both average and 95th/99th percentile latency to capture outliers. Separate successful latency from error-induced latency to avoid misleading averages. Monitor latency at all critical touchpoints, including APIs, service meshes, and external dependencies. 2. Traffic: Measuring Demand Definition: Traffic is a measure of how much demand is being placed on your system. It s typically expressed in requests per second (RPS), queries per second (QPS), sessions, or data throughput. Why It Matters in 2025: With the rise of AI-driven apps, streaming services, and edge computing, traffic patterns have become more dynamic and unpredictable. Monitoring traffic helps teams understand system usage, forecast resource needs, and detect unusual spikes that may indicate abuse, outages, or system regressions. Best Practices: Track per-service traffic to isolate performance issues. Correlate traffic with business metrics (e.g., user signups, purchases) for deeper insight. Be alert to both sudden drops (potential outages) and unusual spikes (possible denial- of-service attacks or bugs). 3. Errors: Measuring Failures Definition: Errors refer to the rate of requests that fail due to client errors, server errors, or system exceptions. Errors are often classified as: 4xx Errors Client-side issues (e.g., bad requests). 5xx Errors Server-side problems (e.g., crashes, timeouts).
Application-level errors Failures defined by business logic (e.g., payment failures). Why It Matters in 2025: In a distributed micro services architecture, errors in one service can cascade into others. With dependencies across third-party APIs, cloud platforms, and internal components, understanding error rates is essential to avoid downtime and data inconsistency. AI-driven alerting systems in 2025 now use historical error patterns to differentiate between expected vs. critical errors, but human oversight is still required for root cause analysis and remediation. Site Reliability Engineering Online Training Best Practices: Alert on error rate trends, not just absolute values. Monitor both client-visible and internal errors. Tag errors with context (service, environment, request ID) for easier troubleshooting. 4. Saturation: Measuring Resource Usage Definition: Saturation indicates how much of a system s total capacity is in use. It typically applies to CPU, memory, disk I/O, database connections, and thread pools. Why It Matters in 2025: Cloud scalability can mask underlying inefficiencies. Just because a system can autoscale doesn't mean it's healthy. High saturation may indicate poor resource management, memory leaks, or runaway processes. Moreover, saturation is often the leading indicator of impending performance degradation. A system nearing 100% saturation has little headroom for spikes and is prone to failure under stress. Best Practices: Monitor saturation alongside throttling and queue lengths. Visualize trends over time to catch slow growth in resource usage. Use per-container and per-node metrics in containerized environments like Kubernetes. Why the Golden Signals Still Matter in 2025 1. Simplicity in Complexity In highly distributed environments with hundreds or thousands of services, the Golden Signals cut through the noise. Instead of attempting to monitor every possible metric, teams can focus on what truly matters to availability and performance. 2. Enabling SLOs and SLIs
The Golden Signals form the basis of Service Level Indicators (SLIs), which are used to measure compliance with Service Level Objectives (SLOs). By tying signals to customer experience, organizations can make informed decisions about reliability vs. feature velocity. 3. Faster Incident Response By providing a standardized way to reason about system behavior, the Golden Signals accelerate root cause identification. When an alert fires, teams can immediately ask: Is it a latency, traffic, error, or saturation issue? 4. Better Collaboration across Teams Whether its development, operations, or security, the Golden Signals give all stakeholders a common language for discussing reliability. They also improve handoffs during on-call rotations and post-incident reviews. SRE Training Evolving Practices in 2025 While the core Golden Signals remain unchanged, how we monitor and act on them has evolved: AI-augmented Observability: Machine learning tools now detect anomalies in signal patterns and reduce alert fatigue by correlating symptoms across services. Open Telemetry and Unified Telemetry Pipelines: Adoption of open standards has improved consistency in how Golden Signals are collected across different environments. Site Reliability Engineering Training Shift-Left Observability: Developers are now instrumenting Golden Signal metrics during the development phase, enabling earlier detection of issues. Final Thoughts In 2025, despite advancements in tooling and infrastructure, the SRE Golden Signals remain as relevant as ever. They are not just metrics they are a philosophy that guides how teams build, operate, and maintain reliable systems. By focusing on latency, traffic, errors, and saturation, organizations can proactively manage risk, maintain customer trust, and respond swiftly to incidents. As systems grow more complex, returning to these foundational principles is not a step backward it s a strategic move forward. Summary To maintain high availability and reliability in 2025, SRE teams must monitor: Latency: For user experience and system responsiveness. Traffic: For usage patterns and scaling needs. Errors: For service health and user trust. Saturation: For resource planning and avoiding overload. Mastering these signals isn t just about monitoring it s about enabling resilient systems and confident teams in a fast-moving digital world.
")