Environmental Impact: Pollution and Catchment Partnerships
Explore the effects of pollution from towns, cities, and transportation on water bodies, along with the initiatives and outcomes of catchment partnerships in England. Discover key statistics and graphics illustrating the environmental challenges and solutions in this insightful infographic template.

Download Presentation

Please find below an Image/Link to download the presentation.
The content on the website is provided AS IS for your information and personal use only. It may not be sold, licensed, or shared on other websites without obtaining consent from the author. If you encounter any issues during the download, it is possible that the publisher has removed the file from their server.
You are allowed to download the files provided on this website for personal or commercial use, subject to the condition that they are used lawfully. All files are the property of their respective owners.
The content on the website is provided AS IS for your information and personal use only. It may not be sold, licensed, or shared on other websites without obtaining consent from the author.
E N D
Presentation Transcript
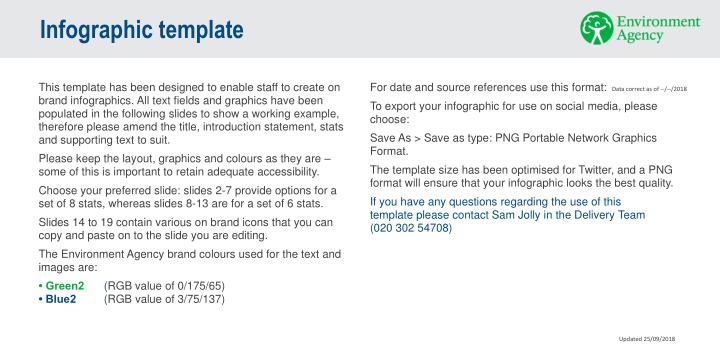
Infographic template This template has been designed to enable staff to create on brand infographics. All text fields and graphics have been populated in the following slides to show a working example, therefore please amend the title, introduction statement, stats and supporting text to suit. Please keep the layout, graphics and colours as they are some of this is important to retain adequate accessibility. Choose your preferred slide: slides 2-7 provide options for a set of 8 stats, whereas slides 8-13 are for a set of 6 stats. Slides 14 to 19 contain various on brand icons that you can copy and paste on to the slide you are editing. The Environment Agency brand colours used for the text and images are: Green2 (RGB value of 0/175/65) Blue2 (RGB value of 3/75/137) For date and source references use this format: To export your infographic for use on social media, please choose: Save As > Save as type: PNG Portable Network Graphics Format. The template size has been optimised for Twitter, and a PNG format will ensure that your infographic looks the best quality. If you have any questions regarding the use of this template please contact Sam Jolly in the Delivery Team (020 302 54708) Data correct as of --/--/2018 Updated 25/09/2018
Pollution from towns cities and transport. 328.9 billion 18% of water bodies impacted by pollution from towns cities and transport miles driven by all motor vehicle traffic in Great Britain for year ending March 2019, an increase of 6.5% from 10 years ago and 15% from 20 years ago 100% 10%
18% Graphic showing that 18% of water bodies are impacted by pollution from towns cities and transport of water bodies impacted by pollution from towns cities and transport 328.9 billion Graphic showing that 328.9 billion miles were driven by all motor vehicle traffic for year ending March 2019, an increase of 6.5% from 10 years ago and 15% from 20 years ago miles driven by all motor vehicle traffic in Great Britain for year ending March 2019, an increase of 6.5% from 10 years ago and 15% from 20 years ago
Catchment Partnerships. 100+ 27,846 What s being done? catchment partnerships bring local knowledge and expertise and are active in each of the 100+ catchments across England 27,846 primary stakeholders engaged in 2017/18 100% 2,835 of habitat created in 2017/18 improving the resilience of catchments 452 What s the outcome? ha partnership projects took place in 2017/18. These tackled a range of pressures and challenges.
Catchment Partnerships. 100+ 27,846 Alt text Graphic shows that Catchment partnerships bring local knowledge and expertise and are active in each of the 100 plus Water Framework Directive catchments across England, including those cross-border with Wales. Graphic also shows that 27,846 primary stakeholders were engaged in 2017/18 catchment partnerships bring local knowledge and expertise and are active in each of the 100+ catchments across England 27,846 primary stakeholders engaged in 2017/18 2,835 of habitat created in 2017/18 improving the resilience of catchments 452 Alt text Graphic showing that partnership projects took place in 2017/18. These tackled a range of pressures and challenges. Graphic also shows that 2,835 ha of habitat was created in 2017/18 improving the resilience of catchments ha partnership projects took place in 2017/18. These tackled a range of pressures and challenges