Epidemiology in Research
Applications of epidemiology in research involve analyzing paired binary data, assessing concordance/discordance, testing associations, adjusting for confounding, and exploring effect modification. Learn about stratification, OR estimation, and distinguishing confounding from effect modification through relevant examples.

Download Presentation

Please find below an Image/Link to download the presentation.
The content on the website is provided AS IS for your information and personal use only. It may not be sold, licensed, or shared on other websites without obtaining consent from the author. If you encounter any issues during the download, it is possible that the publisher has removed the file from their server.
You are allowed to download the files provided on this website for personal or commercial use, subject to the condition that they are used lawfully. All files are the property of their respective owners.
The content on the website is provided AS IS for your information and personal use only. It may not be sold, licensed, or shared on other websites without obtaining consent from the author.
E N D
Presentation Transcript
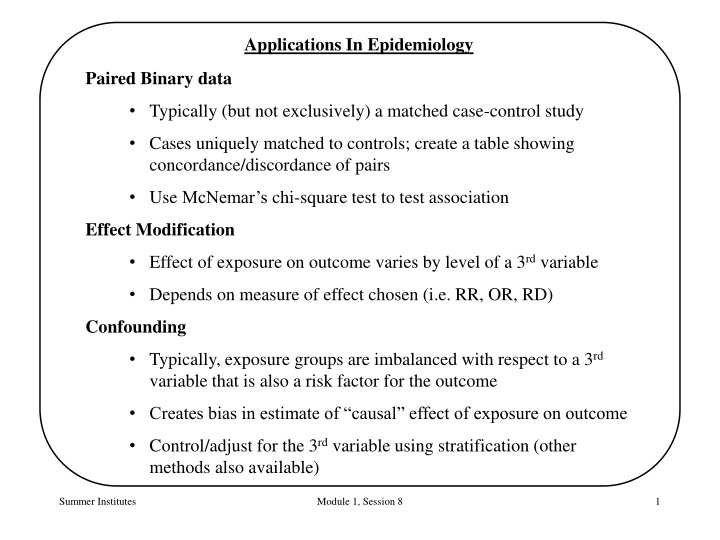
Applications In Epidemiology Paired Binary data Typically (but not exclusively) a matched case-control study Cases uniquely matched to controls; create a table showing concordance/discordance of pairs Use McNemar s chi-square test to test association Effect Modification Effect of exposure on outcome varies by level of a 3rd variable Depends on measure of effect chosen (i.e. RR, OR, RD) Confounding Typically, exposure groups are imbalanced with respect to a 3rd variable that is also a risk factor for the outcome Creates bias in estimate of causal effect of exposure on outcome Control/adjust for the 3rd variable using stratification (other methods also available) Summer Institutes Module 1, Session 8 1
Adjusting the OR via Stratification Compute separate OR for each stratum (OR1, OR2, Ork) Assess homogeneity of OR s across strata (Is there EM?) Ho: OR1 = OR2= = ORK Ha: not all stratum-specific OR s are equal Pool OR s: use weighted average (Adjust for confounding) Global test Ho: ORpool = 1 (Is there association, after adjustment?) Same idea for RR and RD Summer Institutes Module 1, Session 8 2
Exercise 1: Compute 2 and the estimated OR for the AMI paired binary data dataset AMI carrier noncarrier Total carrier 73 23 96 14 103 117 87 126 213 No AMI noncarrier Total Summer Institutes Module 1, Session 8 3
Exercise 2: In each case, decide whether this is an example of confounding or effect modification a) Two hospitals are compared with respect to the rate death following a particular type of surgery. Here are the data is risk group a confounder or effect modifier (use RD)? High risk Hospital A B Low risk Hospital A B Death rate 57/1500 8/200 (3.8%) (4%) 6/600 8/600 (1%) (1.3%) b) A randomized clinical trial is conducted to determine if a new drug can increase levels of HDL cholesterol among men and women. Using the mean difference as a measure of effect, is sex a confounder or effect modifier? Mean HDL Women Men All New Drug 38.9 45.2 40.2 Placebo 39.2 39.1 39.2 Summer Institutes Module 1, Session 8 4
Exercise 2: In each case, decide whether this is an example of confounding or effect modification c) Researchers at the International Agency for Research on Cancer in France found that women infected with both HPV and HSV-2 were nearly three times more likely to get cervical cancer compared to women with only HPV infection. Does HSV-2 confound or modify the effect of HPV on cervical cancer? d) If the mother took antidepressant medication during the first trimester, without accounting for other possible influences, children had roughly twice the risk of having autism. The researchers then compared siblings in families where the mother used antidepressants in one pregnancy but not the other. This helped account for all of the factors that make siblings similar their shared genetics and environment. In the sibling matchup, the children had essentially the same risk for autism, ADHD and poor fetal growth whether they were exposed to antidepressants in the womb or not. Do genetic factors confound or modify the effect of antidepressants on autism? Summer Institutes Module 1, Session 8 5
Exercise 3 Based on the abundance of specific bacterial genera, the human gut microbiota can be divided into two relatively stable groups (enterotypes) that might play a role in personalized nutrition. We studied these simplified enterotypes as prognostic markers for successful body fat loss on two different diets. A total of 62 participants with increased waist circumference were randomly assigned to receive a New Nordic Diet (NND) high in fiber/wholegrain or an Average Danish Diet (ADD) for 26 weeks. At enrollment, participants were grouped into two discrete enterotypes by their relative abundance of Prevotella spp. divided by Bacteroides spp. (P/B ratio) obtained by quantitative PCR analysis. Among individuals with high P/B the NND resulted in a 3.15 kg larger body fat loss compared to ADD whereas virtually no difference (0.88 kg) was observed among individuals with low P/B. Consequently, a 2.27 kg difference in responsiveness to the diets were found between the high and low P/B groups. In summary, subjects with high P/B-ratio appeared more susceptible to lose body fat on diets high in fiber and wholegrain than subjects with a low P/B-ratio. a) Which of the following best describes the design of this study? Cross-sectional survey Case-control study Prospective cohort b) Identify the role of diet, weight loss, and P/B ratio using one of the following terms Outcome, Exposure, Effect modifier, Confounder Summer Institutes Module 1, Session 8 6
Session 8 Solutions 1. (note cases and controls flipped from earlier table; results are the same) | Controls | Cases | Exposed Unexposed | Total -----------------+------------------------+------------ Exposed | 73 23 | 96 Unexposed | 14 103 | 117 -----------------+------------------------+------------ Total | 87 126 | 213 McNemar's chi2(1) = 2.19 Prob > chi2 = 0.1390 Exact McNemar significance probability = 0.1877 Proportion with factor Cases .4507042 Controls .4084507 [95% Conf. Interval] --------- -------------------- difference .0422535 -.0181247 .1026318 ratio 1.103448 .9684942 1.257207 rel. diff. .0714286 -.0197486 .1626057 odds ratio 1.642857 .8101776 3.452833 Summer Institutes Module 1, Session 8 7
Session 8 Solutions 2. a) Confounder b) Effect modifier c) Effect modifier d) Confounder 3. a) Prospective cohort b) Diet: Exposure Weight loss: Outcome P/B ratio: Effect Modifier Summer Institutes Module 1, Session 8 8