Explore the findings from the Erasmus+ mobility survey conducted across four schools, focusing on students' transportation habits and its impact on CO2 emissions. Discover insights from schools in Portugal and Germany, highlighting modes of transportation like walking, cycling, carpooling, and public transport to reduce carbon footprint. Gain valuable information on promoting sustainable mobility practices and reducing emissions in school transportation.
Please find below an Image/Link to download the presentation.
The content on the website is provided AS IS for your information and personal use only. It may not be sold, licensed, or shared on other websites without obtaining consent from the author. If you encounter any issues during the download, it is possible that the publisher has removed the file from their server.
You are allowed to download the files provided on this website for personal or commercial use, subject to the condition that they are used lawfully. All files are the property of their respective owners.
The content on the website is provided AS IS for your information and personal use only. It may not be sold, licensed, or shared on other websites without obtaining consent from the author.
E N D
Presentation Transcript
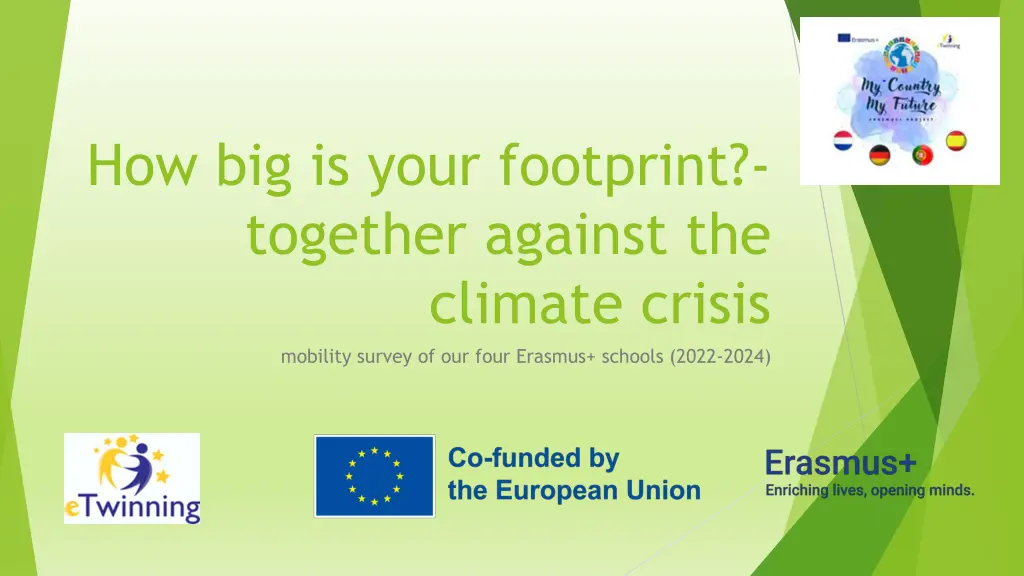
How big is your footprint?- together against the climate crisis mobility survey of our four Erasmus+ schools (2022-2024)
Overview Foreword: Our aims, our working methods Results from the different schools How can we improve? Evaluation and recommendations
Foreword: How do students get to school in our countries? In our common European attempt to reduce CO2 emission at our schools mobility plays a crucial role. During our Erasmus-Project we gathered considerable data about our mobility behaviour. We want to compare our conditions and help each other to improve our situation. We will hopefully learn from each other how to reduce CO2 emission in the mobility sector. In general we would appreciate a situation, where large numbers of pupils and teachers go to school by bike or on foot as it doesn t produce any emissions. Public transport should also be promoted for longer ways to school, as it could easily reduce the emissions and the communities could decide to switch to electric-drives or hydrogen in their buses and trains.
Working method: survey Survey designed by students of Gutenberg-Gymnasium (Greenteam feat. Erasmus+). Approximately 400 participants (students) with the help of teachers from all schools (during the mobilities and remotely). The evaluation by Greenteam feat. Erasmus+ during our workshops. Duration of the project: 2022- 2024.
Data from Sintra (Portugal) Most oft he portuguese students walk to school or come to school with car but only a few do carpools. The least amount of the students take a bicycle. Less than take public transportation like bus or train. In grade 11 the survey shows that 40% oft the students walk to school only a little bit behind those 40% is with 37% driving to school with a car, only 9 from 43 people who answered do carpools. Only a small amount of the students go by bike or drive by public transportation. In grade 10 the results are similar but here the distance between driving by car (47,5%) and walking (27,5%) is even bigger but still the least amount of go by bike (0%). The amount of people going by public transport is 25%.
Data from Gutenberg-Gymnasium Bergheim mainly public transport (40%, bus) bike and car are aproximately at thze same percentage (bike: 20,25%; car: 20,01%) More than 50 percent get to school by carpooling Walking to school ist the least liked way to get to school reaching only 18,37% The average way to school has 4,8km
Data from Gutenberg-Gymnasium Bergheim The survey at our school Gutenberg-Gymnasium across all levels shows that pupils predominantly come to school by public transport (bus with 40.05%). This is followed by cycling to school (20.52%) and driving (20.01%), which are equally "popular". More than half of the pupils who come to school by car form carpools. The last option is walking to school, which is used by the fewest pupils (18.37%). It is striking that pupils predominantly use environmentally friendly modes of transport to get to school: 78.94% (on foot, by bike and by bus). The fact that most pupils on average use public transport to get to school is due to the fact that the students are reimbursed for travel costs, depending on the length of their journey to school. Taking a look at the distance the students have to overcome to get to shool shows that at primary level, the minimum distance is more than two kilometers, at secondary level 1 more than 3.5 kilometers and at secondary level 2 more than five kilometers.
Data from Colegio Sopea Badajoz In Spain, 41% of pupils walk to school. 56% of pupils are driven to school by car or drive to school themselves, as only 3 % use public transport and take the bus to school. It is particularly striking that 0% of pupils cycle to school. In contrast to this data is the average number of kilometers students who travel to school with only 3.1 km. Despite the average short journey to school, almost a third of the students use the car to get to school every day. 14 students of those using a carform carpools in contrast to the other 12 which do not.
Data from Zone College Doetinchem The results of the survey in the Netherlands clearly show that pupils have the longest average distance to school (7.8 km). Nevertheless most pupils (71%) cycle to school. Only 5% walk to school. Public transport (in this case the bus) also accounts for 17% and 7% of pupils come to school by car. When it comes to carpooling, only one in twelve pupils makes use of it.
Evaluation and recommendations In Portugal 37% go to school by car, 21% go by bus. A large number of 40% go on foot, but only a small number of pupils use a bike. The questions could be, how to reduce the number of rides by car and how to increase the number of bikers.
Evaluation and recommendations 41% of the Spanish students walk to school, while 56% go by car. Bikes and buses are hardly used so the school has a large potential to reduce their emissions in this sector.
Evaluation and recommendations One interesting finding from the German survey is that many pupils use the buses, but switch to cars as soon as they get their driver s license. We can conclude that the German public transport is usable and sometimes even practical if you bring some time, but far away from comfortable. Furthermore our bike-paths often seem dangerous or suddenly end in the middle of the car traffic. It therefore makes sense to ask the community to improve the situation.
Evaluation and recommendations In the Netherlands, 17% go by bus, 71% go by bike, 5% walk. So the large number of school ways is already acceptable concerning the emissions. Only 7% go by car. Ideally the community could switch their buses to electric or hydrogen driven engines soon. During a public discussion with pupils from all schools and local politicians from Germany we recognized that the other schools can learn from the Netherlands in terms of mobility in general and cycling in particular.
How else can we improve? Streets in front oft the schools could be closed for the cars, so that maybe more students would get to school by bus and not by car Students who are 18 years old or older and have a driving licence should think about the possibility to still go by the bus or for example the bike instead of drivin by their car There should be more school busses fort the students (many students do not take the bus because they are mostly crowded) Bike paths and parking lots for bikes in front of the school -> more attractive for students to get to school by bike Bikepooling -> students driving together (maybe also with guides fort he younger students) Reduced prices for public services If you are too lazy to ride your bike it would even be better to buy an electric bike instead of driving by car


")
")