ERC Grants and Horizon 2020 Work Programme 2019 Webinar
This webinar discusses ERC grants and the new Horizon 2020 work programme for 2019. Topics include the impact section of an H2020 proposal, insights from Ukrainian and French NCPs, and a Q&A session.

Download Presentation

Please find below an Image/Link to download the presentation.
The content on the website is provided AS IS for your information and personal use only. It may not be sold, licensed, or shared on other websites without obtaining consent from the author.If you encounter any issues during the download, it is possible that the publisher has removed the file from their server.
You are allowed to download the files provided on this website for personal or commercial use, subject to the condition that they are used lawfully. All files are the property of their respective owners.
The content on the website is provided AS IS for your information and personal use only. It may not be sold, licensed, or shared on other websites without obtaining consent from the author.
E N D
Presentation Transcript
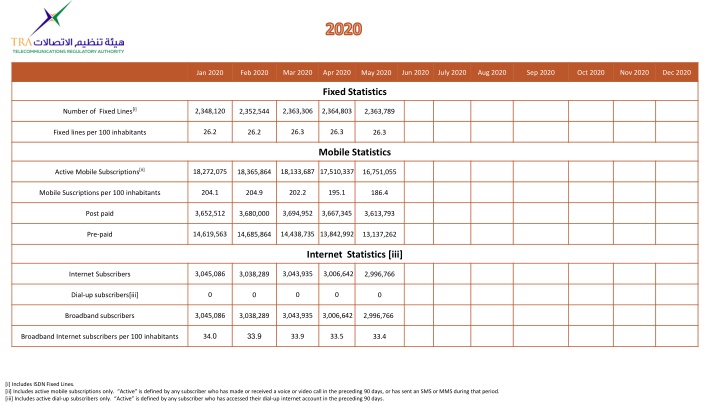
2020 Mar 2020 Apr 2020 Jun 2020 July 2020 Aug 2020 Sep 2020 Oct 2020 Nov 2020 Dec 2020 Jan 2020 Feb 2020 May 2020 Fixed Statistics Number of Fixed Lines[i] 2,348,120 2,363,306 2,364,803 2,352,544 2,363,789 26.2 26.3 26.3 26.2 Fixed lines per 100 inhabitants 26.3 Mobile Statistics Active Mobile Subscriptions[ii] 18,272,075 18,133,687 17,510,337 18,365,864 16,751,055 204.1 202.2 195.1 204.9 Mobile Suscriptions per 100 inhabitants 186.4 3,652,512 3,694,952 3,667,345 3,680,000 Post paid 3,613,793 14,619,563 14,438,735 13,842,992 14,685,864 Pre-paid 13,137,262 Internet Statistics [iii] 3,045,086 3,043,935 3,006,642 3,038,289 Internet Subscribers 2,996,766 0 0 0 0 Dial-up subscribers[iii] 0 3,045,086 3,043,935 3,006,642 3,038,289 Broadband subscribers 2,996,766 34.0 33.9 33.9 33.5 Broadband Internet subscribers per 100 inhabitants 33.4 [i] Includes ISDN Fixed Lines. [ii] Includes active mobile subscriptions only. Active is defined by any subscriber who has made or received a voice or video call in the preceding 90 days, or has sent an SMS or MMS during that period. [iii] Includes active dial-up subscribers only. Active is defined by any subscriber who has accessed their dial-up internet account in the preceding 90 days.
2019 Mar 2019 Apr 2019 Jun 2019 July 2019 Aug 2019 Sep 2019 Oct 2019 Nov 2019 Dec 2019 Jan 2019 Feb 2019 May 2019 Fixed Statistics Number of Fixed Lines[i] 2,329,011 2,328,781 2,329,506 2,324,612 2,326,273 2,332,241 2,336,465 2,340,355 2,345,578 2,322,756 2,321,748 2,331,518 26.2 26.2 26.2 26.1 26.1 26.1 26.2 26.2 26.2 Fixed lines per 100 inhabitants 26.2 26.2 26.2 Mobile Statistics 18,765,04 4 Active Mobile Subscriptions[ii] 19,181,248 18,999,237 18,520,992 18,337,758 18,261,961 18,137,577 18,166,931 18,178,323 18,278,817 19,320,544 19,269,480 216.0 213.8 208.0 205.8 204.8 203.2 203.4 203.3 204.3 Mobile Suscriptions per 100 inhabitants 217.9 217.2 210.9 3,499,911 3,511,303 3,509,074 3,509,538 3,521,025 3,547,755 3,581,260 3,600,394 3,623,796 Post paid 3,454,954 3,452,424 3,523,511 15,241,53 3 15,681,337 15,487,934 15,011,918 14,828,220 14,740,936 14,589,822 14,585,671 14,577,929 14,655,021 Pre-paid 15,865,590 15,817,056 Internet Statistics [iii] 3,013,370 3,008,678 3,005,305 2,999,178 3,003,185 3,009,851 3,022,018 3,030,515 3,045,957 Internet Subscribers 3,019,532 3,010,701 3,007,890 0 0 0 0 0 0 0 0 0 Dial-up subscribers[iii] 0 0 0 3,013,370 3,008,678 3,005,305 2,999,178 3,003,185 3,009,851 3,022,018 3,030,515 3,045,957 Broadband subscribers 3,019,532 3,010,701 3,007,890 33.9 33.9 33.8 33.7 33.7 33.7 33.8 33.9 34.04 Broadband Internet subscribers per 100 inhabitants 34.1 33.9 33.8 [i] Includes ISDN Fixed Lines. [ii] Includes active mobile subscriptions only. Active is defined by any subscriber who has made or received a voice or video call in the preceding 90 days, or has sent an SMS or MMS during that period. [iii] Includes active dial-up subscribers only. Active is defined by any subscriber who has accessed their dial-up internet account in the preceding 90 days.
2018 Mar 2018 Apr 2018 Jun 2018 July 2018 Aug 2018 Sep 2018 Oct 2018 Nov 2018 Dec 2018 Jan 2018 Feb 2018 May 2018 Fixed Statistics Number of Fixed Lines[i] 2,292,098 2,285,807 2,323,040 2,323,154 2,319,128 2,326,355 2,329,955 2,337,357 2,335,491 2,292,443 2,297,970 2,259,329 26.1 26.0 26.4 26.4 26.3 26.3 26.4 26.4 26.4 Fixed lines per 100 inhabitants 26.1 26.2 25.5 Mobile Statistics Active Mobile Subscriptions[ii] 20,411,955 20,400,708 20,253,983 19,621,025 19,440,047 19,153,232 19,199,959 19,259,959 19,475,483 19,997,756 20,215,968 19,368,044 232.1 231.8 230.0 222.6 220.4 216.9 217.3 217.8 219.8 Mobile Suscriptions per 100 inhabitants 227.8 230.1 218.8 3,347,508 3,354,031 3,362,933 3,381,218 3,407,865 3,419,272 3,441,256 3,451,778 3,460,320 Post paid 3,298,347 3,325,973 3,463,305 17,064,447 17,046,677 16,891,050 16,239,807 16,032,182 15,733,960 15,758,703 15,808,181 16,015,163 Pre-paid 16,699,409 16,889,995 15,904,739 Internet Statistics [iii] 2,856,965 2,849,161 3,043,235 3,046,937 3,045,447 3,047,409 3,017,597 3,032,577 3,024,565 Broadband Subscriptions 2,780,970 2,863,712 3,022,059 32.492% 32.376% 34.553% 34.566% 34.521% 34.514% 34.148% 34.290% 34.143% Broadband Internet Subscriptions per 100 inhabitants 31.680% 32.596% 34.142% [i] Includes ISDN Fixed Lines. [ii] Includes active mobile subscriptions only. Active is defined by any subscriber who has made or received a voice or video call in the preceding 90 days, or has sent an SMS or MMS during that period. [iii] Revised Figures for Fixed Broadband.
2017 Mar 2017 Apr 2017 Jun 2017 July 2017 Aug 2017 Sep 2017 Oct 2017 Nov 2017 Dec 2017 Jan 2017 Feb 2017 May 2017 Fixed Statistics Number of Fixed Lines[i] 2,298,389 2,300,900 2,289,452 2,295,946 2,303,986 2,311,499 2,320,837 2,287,287 2,292,508 2,299,886 2,288,603 2,322,126 26.5 26.5 26.3 26.3 26.4 26.4 26.5 Fixed lines per 100 inhabitants 26.4 26.4 26.4 26.2 26.5 Mobile Statistics 19,905,13 7 19,711,28719,752,473 19,916,809 19,790,05 5 19,702,98 0 19,756,56 0 Active Mobile Subscriptions[ii] 19,835,288 19,670,498 19,689,914 19,691,478 19,790,055 228.3 228.9 226.2 228.0 225.0 225.0 224.7 228.3 Mobile Suscriptions per 100 inhabitants 228.3 227.0 226.9 226.4 3,209,909 3,238,040 3,282,966 3,257,215 3,270,137 3,318,629 3,317,232 3,257,386 3,169,888 Post paid 3,169,888 3,181,590 3,269,234 16,667,09 7 16,620,16 7 16,521,39 0 16,487,32 6 16,625,379 16,428,321 16,495,258 16,646,672 16,351,869 16,372,682 16,434,092 16,620,167 Pre-paid Internet Statistics 1,309,229 1,312,419 1,317,461 1,323,262 1,332,155 1,339,343 1,348,844 1,299,382 Internet Subscriptions 1,299,382 1,304,858 1,317,371 1,315,631 290 Dial-up Subscriptions [iii] 285 269 230 210 159 148 296 296 291 281 249 1,308,939 1,312,134 1,317,192 1,315,382 1,323,032 1,331,945 1,339,184 1,348,696 1,299,086 Broadband Subscriptions 1,299,086 1,304,567 1,317,090 15.1 15.2 15.3 15.1 15.1 15.1 15.4 15.0 Broadband Internet Subscriptions per 100 inhabitants 15.0 15.0 15.1 15.1 [i] Includes ISDN Fixed Lines. [ii] Includes active mobile subscriptions only. Active is defined by any subscriber who has made or received a voice or video call in the preceding 90 days, or has sent an SMS or MMS during that period. [iii] Includes active dial-up subscribers only. Active is defined by any subscriber who has accessed their dial-up internet account in the preceding 90 days.
2016 Mar 2016 Apr 2016 Jun 2016 July 2016 Aug 2016 Sep 2016 Oct 2016 Nov 2016 Dec 2016 Jan 2016 Feb 2016 May 2016 Fixed Statistics Number of Fixed Lines[i] 2,285,809 2,268,951 2,273,321 2,275,574 2,279,204 2,275,169 2,284,134 2,281,209 2,292,053 2,299,207 2,309,856 2,318,007 26.4 Fixed lines per 100 inhabitants 26.5 26.5 26.5 26.5 26.5 26.5 26.5 26.6 26.6 26.7 26.8 Mobile Statistics Active Mobile Subscriptions[ii] 19,687,286 19,905,093 18,276,409 18,590,788 18,828,338 19,099,868 19,248,272 19,133,341 19,159,991 19,077,592 19,350,439 19,608,289 227.6 229.8 Mobile Suscriptions per 100 inhabitants 213.5 217 219.5 222.4 223.9 222.3 222.4 221.2 224.2 226.9 3,112,101 3,143,065 Post paid 2,842,765 2,867,281 2,910,784 2,949,529 2,966,600 2,986,713 2,997,067 3,008,527 3,029,173 3,070,634 16,575,185 16,762,028 Pre-paid 15,433,644 15,723,507 15,917,554 16,150,339 16,281,672 16,146,628 16,162,924 16,069,065 16,321,266 16,537,655 Internet Statistics 1,297,617 Internet Subscriptions 1,244,542 1,251,284 1,252,651 1,255,775 1,253,354 1,261,532 1,261,004 1,270,519 1,275,817 1,287,910 1,296,357 Dial-up Subscriptions [iii] 313 1,370 1,149 750 348 499 473 504 421 390 378 350 1,297,304 Broadband Subscriptions 1,243,172 1,250,135 1,251,901 1,255,427 1,252,855 1,261,059 1,260,500 1,270,098 1,275,427 1,287,532 1,296,007 14.98 Broadband Internet Subscriptions per 100 inhabitants 14.5 14.6 14.6 14.6 14.6 14.7 14.6 14.7 14.8 14.9 15 [i] Includes ISDN Fixed Lines. [ii] Includes active mobile subscriptions only. Active is defined by any subscriber who has made or received a voice or video call in the preceding 90 days, or has sent an SMS or MMS during that period. [iii] Includes active dial-up subscribers only. Active is defined by any subscriber who has accessed their dial-up internet account in the preceding 90 days.
2015 Mar 2015 Apr 2015 Jun 2015 July 2015 Aug 2015 Sep 2015 Oct 2015 Nov 2015 Dec 2015 Fixed Statistics Jan 2015 Feb 2015 May 2015 Fixed Statistics Number of Fixed Lines[i] 2,212,684 2,222,244 2,219,867 2,218,142 2,221,898 2,231,644 2,240,808 2,253,341 2,258,646 2,186,459 2,199,141 2,233,815 26.1 26.2 26.1 26.1 26.1 26.2 26.3 26.4 26.4 25.9 26.0 26.3 Fixed lines per 100 inhabitants Mobile Statistics Jan-12 Feb-12 Mar-12 Apr-12 May-12 Jun-12 Jul-12 Aug-12 Sep-12 Oct-12 Nov-12 Dec-12 Active Mobile Subscriptions[ii] 17,321,918 17,627,912 17,186,707 17,106,686 17,197,214 17,383,566 17,792,324 18,119,835 17,942,560 16,806,229 16,930,823 17,835,596 204.6 208.0 202.3 201.2 202.0 204.0 208.5 212.2 209.9 198.9 200.2 210.2 Mobile Subscriptions per 100 inhabitants 2,562,737 2,623,047 2,674,235 2,681,256 2,701,259 2,713,594 2,764,953 2,815,666 2,802,859 2,468,128 2,513,895 2,650,154 Post paid 14,759,181 15,004,865 14,512,472 14,425,430 14,495,955 14,669,972 15,027,371 15,304,169 15,139,701 14,338,101 14,416,928 15,185,442 Pre-paid Internet Statistics Jan-12 Feb-12 Mar-12 Apr-12 May-12 Jun-12 Jul-12 Aug-12 Sep-12 Oct-12 Nov-12 Dec-12 1,173,384 1,184,978 1,192,780 1,193,869 1,203,103 1,211,312 1,222,276 1,231,791 1,235,312 1,149,331 1,160,353 1,196,034 Internet Subscriptions Dial-up Subscriptions [iii] 2,929 2,715 2,417 2,025 1,812 1,752 1,552 1,390 1,254 3,399 2,862 2,421 1,170,455 1,182,263 1,190,363 1,191,844 1,201,291 1,209,560 1,220,724 1,230,401 1,234,058 1,145,932 1,157,491 1,193,613 Broadband Subscriptions Broadband Internet Subscriptions per 100 inhabitants 13.8 13.9 14.0 14.0 14.1 14.2 14.3 14.4 14.43 13.6 13.7 14.1 [i] Includes ISDN Fixed Lines. [ii] Includes active mobile subscriptions only. Active is defined by any subscriber who has made or received a voice or video call in the preceding 90 days, or has sent an SMS or MMS during that period. [iii] Includes active dial-up subscribers only. Active is defined by any subscriber who has accessed their dial-up internet account in the preceding 90 days.
2014 Fixed Statistics Jan-14 Feb-14 Mar-14 Apr-14 May-14 Jun-14 Jul-14 Aug-14 Sep-14 Oct-14 Nov-14 Dec-14 Number of Fixed Lines[i] 2,090,021 2,100,519 2,111,309 2,120,918 2,125,332 2,101,137 2,118,917 2,121,017 2,126,536 2,121,745 2,120,965 2,103,036 Fixed lines per 100 inhabitants 25.1 25.2 25.3 25.4 25.4 25.1 25.2 25.2 25.3 25.2 25.2 24.9 Mobile Statistics Jan-12 Feb-12 Mar-12 Apr-12 May-12 Jun-12 Jul-12 Aug-12 Sep-12 Oct-12 Nov-12 Dec-12 Active Mobile Subscriptions[ii] 16,400,972 16,689,498 16,930,069 17,084,980 17,189,209 16,838,060 17,004,612 16,857,419 17,132,724 16,969,276 16,964,652 16,819,024 Mobile Suscriptions per 100 inhabitants 196.7 199.9 202.6 204.2 205.2 200.8 202.6 200.6 203.7 201.5 201.2 199.3 Post paid 2,149,412 2,200,895 2,247,187 2,303,788 2,331,344 2,341,002 2,395,731 2,402,275 2,446,656 2,382,972 2,436,902 2,470,470 Pre-paid 14,251,560 14,488,603 14,682,882 14,781,192 14,857,865 14,497,058 14,608,881 14,455,144 14,686,068 14,586,304 14,527,750 14,348,554 Internet Statistics Jan-12 Feb-12 Mar-12 Apr-12 May-12 Jun-12 Jul-12 Aug-12 Sep-12 Oct-12 Nov-12 Dec-12 Internet Subscriptions 1,050,673 1,058,602 1,066,298 1,074,802 1,080,729 1,060,004 1,082,690 1,091,295 1,102,493 1,102,737 1,104,039 1,090,293 Dial-up Subscriptions [iii] 1,250 1,184 1,070 1,007 937 863 813 724 668 627 495 380 Broadband Subscriptions 1,049,423 1,057,418 1,065,228 1,073,795 1,079,792 1,059,141 1,081,877 1,090,571 1,101,825 1,102,110 1,103,544 1,089,913 Broadband Internet Subscriptions per 100 inhabitants 12.6 12.7 12.7 12.8 12.9 12.6 12.9 13 13.1 13.1 13.1 12.91 [i] Includes ISDN Fixed Lines. [ii] Includes active mobile subscriptions only. Active is defined by any subscriber who has made or received a voice or video call in the preceding 90 days, or has sent an SMS or MMS during that period. [iii] Includes active dial-up subscribers only. Active is defined by any subscriber who has accessed their dial-up internet account in the preceding 90 days.
2013 Fixed Statistics Jan-13 Feb-13 Mar-13 Apr-13 May-13 Jun-13 Jul-13 Aug-13 Sep-13 Oct-13 Nov-13 Dec-13 Number of Fixed Lines[i] 1,981,214 1,994,540 1,994,540 2,008,691 2,035,929 2,044,498 2,053,797 2,059,760 2,070,470 2,079,007 2,080,814 2,086,015 Fixed lines per 100 inhabitants 24.1 24.2 24.2 24.4 24.6 24.7 24.8 24.8 24.9 25.0 25.0 25.0 Mobile Statistics Jan-12 Feb-12 Mar-12 Apr-12 May-12 Jun-12 Jul-12 Aug-12 Sep-12 Oct-12 Nov-12 Dec-12 Active Mobile Subscriptions[ii] 14,012,787 14,147,287 14,147,287 14,321,169 14,619,505 14,949,937 14,930,471 15,129,432 15,471,466 15,673,475 15,871,459 16,063,547 Mobile Suscriptions per 100 inhabitants 170.3 171.8 171.8 173.7 176.9 180.7 180.3 182.5 186.4 188.6 190.8 192.9 Post paid 1,748,989 1,765,947 1,765,947 1,802,107 1,849,707 1,891,624 1,938,966 1,960,201 2,000,361 2,034,163 2,077,453 2,110,784 Pre-paid 12,263,798 12,381,340 12,381,340 12,519,062 12,769,798 13,058,313 12,991,505 13,169,231 13,471.105 13,639,312 13,794,006 13,952,763 Internet Statistics Internet Subscriptions 966,787 976,791 976,791 984,552 1,003,406 1,007,774 1,013,106 1,018,315 1,027,092 1,036,008 1,038,926 1,043,276 Dial-up Subscriptions [iii] 3,020 2,850 2,850 2,697 2,396 2,195 2,037 1,847 1,640 1,485 1,438 1,342 Broadband Subscriptions 963,767 973,941 973,941 981,855 1,001,010 1,005,579 1,011,069 1,016,468 1,025,452 1,034,523 1,037,488 1,041,934 Broadband Internet Subscriptions per 100 inhabitants 11.7 11.8 11.8 11.9 12.1 12.2 12.2 12.3 12.4 12.4 12.5 12.5 [i] Includes ISDN Fixed Lines. [ii] Includes active mobile subscriptions only. Active is defined by any subscriber who has made or received a voice or video call in the preceding 90 days, or has sent an SMS or MMS during that period. [iii] Includes active dial-up subscribers only. Active is defined by any subscriber who has accessed their dial-up internet account in the preceding 90 days.
2012 Fixed Statistics Jan-12 Feb-12 Mar-12 Apr-12 May-12 Jun-12 Jul-12 Aug-12 Sep-12 Oct-12 Nov-12 Dec-12 Number of Fixed Lines[i] 1,836,644 1,862,373 1,880,725 1,892,671 1,901,877 1,904,756 1,910,296 1,916,569 1,927,407 1,941,320 1,952,211 1,967,486 Fixed lines per 100 inhabitants 22.9 23.2 23.4 23.5 23.5 23.5 23.5 23.6 23.6 23.8 23.8 24.0 Mobile Statistics Jan-12 Feb-12 Mar-12 Apr-12 May-12 Jun-12 Jul-12 Aug-12 Sep-12 Oct-12 Nov-12 Dec-12 Active Mobile Subscriptions[ii] 11,939,757 12,104,938 12,367,290 12,490,659 12,610,957 12,745,197 1,647,440 159.9 13,041,707 13,346,677 13,574,052 13,775,252 Mobile Suscriptions per 100 inhabitants 149.1 150.8 153.8 154.9 156.1 157.4 158.4 159.2 159.9 163.3 165.7 167.8 Post paid 1,393,893 1,411,456 1,454,782 1,484,961 1,508,033 1,523,863 1,544,284 1,561,274 1,647,440 1,678,832 1,702,172 1,715,103 Pre-paid 10,545,864 10,693,482 10,912,508 11,005,698 11,102,924 11,221,334 11,312,024 11,392,453 11,394,267 11,667,845 11,871,880 12,060,149 Internet Statistics Jan-12 Feb-12 Mar-12 Apr-12 May-12 Jun-12 Jul-12 Aug-12 Sep-12 Oct-12 Nov-12 Dec-12 Internet Subscriptions 888,932 894,499 904,270 911,466 915,710 918,954 920,877 926,317 934,943 945,116 952,251 957,816 Dial-up Subscriptions [iii] 6,968 5,891 5,757 5,255 4,981 4,650 4,359 3,992 3,757 3,589 2,550 2,828 Broadband Subscriptions 881,964 888,608 898,513 906,211 910,729 914,304 916,518 922,325 931,186 941,527 949,701 954,988 Broadband Internet Subscriptions per 100 inhabitants 11.0 11.1 11.2 11.2 11.3 11.3 11.3 11.3 11.4 11.5 11.6 11.6 [i] Includes ISDN Fixed Lines. [ii] Includes active mobile subscriptions only. Active is defined by any subscriber who has made or received a voice or video call in the preceding 90 days, or has sent an SMS or MMS during that period. [iii] Includes active dial-up subscribers only. Active is defined by any subscriber who has accessed their dial-up internet account in the preceding 90 days.
2011 Fixed Statistics Jan-11 Feb-11 Mar-11 Apr-11 May-11 Jun-11 Jul-11 Aug-11 Sep-11 Oct-11 Nov-11 Dec-11 Number of Fixed Lines[i] 1,701,200 1,710,063 1,722,060 1,731,660 1,731,241 1,745,264 1,752,849 1,760,031 1,774,308 1,788,180 1,804,485 1,825,496 Fixed lines per 100 inhabitants 30.5 30.6 30.6 30.6 30.5 30.6 30.5 30.5 30.6 30.7 30.8 31.0 Mobile Statistics Jan-11 Feb-11 Mar-11 Apr-11 May-11 Jun-11 Jul-11 Aug-11 Sep-11 Oct-11 Nov-11 Dec-11 Active Mobile Subscriptions[ii] 11,053,369 11,155,247 11,066,525 11,086,804 11,152,455 11,179,767 11,120,466 11,168,308 11,261,768 11,409,524 11,540,040 11,727,401 Mobile Suscriptions per 100 inhabitants 198.5 199.3 196.7 196.1 196.3 195.8 193.8 193.6 194.3 195.9 197.1 199.3 Post paid 1,201,823 1,216,717 1,238,273 1,257,752 1,279,193 1,284,539 1,297,223 1,312,356 1,329,606 1,349,942 1,362,109 1,371,827 Pre-paid 9,851,546 9,938,530 9,828,252 9,829,052 9,873,262 9,895,228 9,823,243 9,855,952 9,932,162 10,059,582 10,177,931 10,355,574 Internet Statistics Jan-11 Feb-11 Mar-11 Apr-11 May-11 Jun-11 Jul-11 Aug-11 Sep-11 Oct-11 Nov-11 Dec-11 Internet Subscriptions 1,369,260 1,368,569 1,366,770 1,358,464 1,351,048 1,340,883 1,335,396 1,329,675 1,332,837 1,337,592 1,335,587 1,324,059 Dial-up Subscriptions [iii] 573,079 564,598 553,364 540,793 528,493 515,729 505,612 497,489 490,579 483,575 472,268 453,915 Broadband Subscriptions 796,181 803,971 813,406 817,671 822,555 825,154 829,784 832,186 842,258 854,017 863,319 870,144 Broadband Internet Subscriptions per 100 inhabitants 14.3 14.4 14.5 14.5 14.5 14.5 14.5 14.4 14.5 14.7 14.7 14.8 [i] Includes ISDN Fixed Lines. [ii] Includes active mobile subscriptions only. Active is defined by any subscriber who has made or received a voice or video call in the preceding 90 days, or has sent an SMS or MMS during that period. [iii] Includes active dial-up subscribers only. Active is defined by any subscriber who has accessed their dial-up internet account in the preceding 90 days.