ERCOT Large Load Loss Reduction Events Analysis 2020-2024 Insights
Dive into ERCOT's loss and reduction of large load events from 2020 to 2024, identifying key patterns, system faults, and load reduction strategies. Explore the impact on power electronic loads (PEL) and the significance of Large Load Interconnection (LLI) processes in managing Texas' energy consumption. Discover details on events leading to load reductions, including insights on industrial loads, fault clearing delays, and system frequency adjustments for improved performance in the Texas Coast and West Texas regions.

Download Presentation

Please find below an Image/Link to download the presentation.
The content on the website is provided AS IS for your information and personal use only. It may not be sold, licensed, or shared on other websites without obtaining consent from the author. If you encounter any issues during the download, it is possible that the publisher has removed the file from their server.
You are allowed to download the files provided on this website for personal or commercial use, subject to the condition that they are used lawfully. All files are the property of their respective owners.
The content on the website is provided AS IS for your information and personal use only. It may not be sold, licensed, or shared on other websites without obtaining consent from the author.
E N D
Presentation Transcript
ERCOT Large Load Loss/Reduction Events 2020-2024 Patrick Gravois Operations Engineer Operations Analysis LFLTF Meeting March 4, 2025
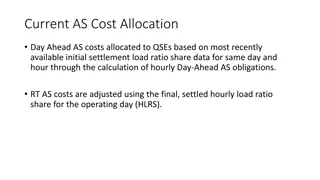
ERCOT Loss/Reduction of Load Events 2020-2023 13 events identified by ERCOT Operations that involved system fault followed by significant reduction of one or more large loads Event chart previously presented at April 2024 LFLTF; needed more context Recently reviewed events to distinguish reduction of large loads that have gone through interim Large Load Interconnection (LLI) process since 1/1/2022 LLI loads are greater than 25 MW and may include crypto, AI, data center, hydrogen fuel cell loads, or industrial loads and are aggregated into single PI tag for monitoring purposes To date, ERCOT has approved to energize ~6,300 MW of large load through LLI process Observed peak simultaneous consumption of ~3,100 MW Non-simultaneous peak consumption is 4,616 MW All LLI loads involved in events are power electronic loads (PEL), and specifically crypto (to our knowledge) 8 events involve a single large industrial load on the Texas coast (non-LLI) 3 events involve either multiple 3-phase faults or significantly delayed fault clearing Events involve wide-spread reduction of consumption of many load types and sizes 2 events involve simultaneous loss of both IBR generation and PELs 2 PUBLIC
ERCOT Loss/Reduction of Load Events 2020-2023 LLI/PEL Load Loss included in Total Load Loss Reduction of affected PELs varies from 39% to 82% of pre-disturbance consumption 3 PUBLIC
ERCOT Loss/Reduction of Load Events 2020-2023 Texas Coast Load Loss Events (8 Events from Nov. 2020 Mar. 2023) Single large industrial load Repeated large load reductions of ~400-700 MWs due to faults in the area High system frequencies up to ~60.11 Hz Updated variable frequency drive settings and internal systems to improve ride-though capabilities Improved performance seen in 2024 West Texas Event Oct. 12, 2022 @ 05:56 CT 415 MW load reduction Multiple normally cleared Three-Phase Line-to-Ground (3LG) faults within one minute at 345 kV station ~60 loads in West Texas reduced a combined ~415 MW during the event 7 large PELs reduced a combined 107 MWs (52% of consumption) System frequency increased to 60.086 Hz DFW Event Oct. 31, 2022 @ 23:12 CT 500 MW load reduction 3LG fault at 138 kV station with delayed ~10 cycle clearing due to breaker misoperation ~100 loads in the area temporarily reduced ~500 MW during the event No large PEL loss identified during the event System frequency increased to 60.132 Hz 4 PUBLIC
ERCOT Loss/Reduction of Load Events 2020-2023 West Texas Event Dec. 7, 2022 @ 03:50 CT 1560 MW load reduction Multiple Single-Phase Line-to-Ground (SLG) faults and a 3LG ground fault at 138 kV station with delayed 19-cycle clearing due to beaker failure Hundreds of loads in Far West Weather zone reduced ~1,560 MW during the event due to extended low voltage period 10 large PELs reduced a combined ~162 MW (39% of consumption) Largest load reduction from oil and gas production, processing, and delivery facilities (~420 MW from 24 loads) System frequency increased to 60.235 Hz and recovered in 12m27s 112 MW of thermal generation tripped during event MW Range of Load Reduction # of Far West Loads in Range Total MW Reduction Greater than 10 MW 41 816 Between 5 MW and 10 MW 46 318 Between 2 and 5 MW 93 314 Between 0 and 2 MW 193 118 5 PUBLIC
ERCOT Loss/Reduction of Load Events 2020-2023 West Texas Event Jan. 23, 2023 @ 12:19 CT SLG fault at 138 kV station with normal 4-cycle clearing 5 large PELs reduced a combined 212 MWs (82% of consumption) 253 MW of IBR generation loss (all solar) PEL loss identified during event analysis of IBR generation loss West Texas Event Oct. 26, 2023 @ 10:28 CT SLG Fault at 138 kV station with normal 4-cycle clearing 6 large PELs reduced a combined 177 MWs (57% of consumption) 246 MW of IBR generation loss (all solar) PEL loss identified during event analysis of IBR generation loss 6 PUBLIC
Large Power Electronic Load Ride-Through Events November 2023 - Present Searched for events in which LLI aggregate tag dropped >100 MW combined with PMU fault flag and system frequency spike Collected PMU/DFR data at POIB of large loads from interconnecting TSPs Data availability (NOGRR 255) Confirm fault details and low voltage at POIB during events Confirm MW reduction in consumption and observe dynamics of large loads during faults 24 events from areas of concentrated large PELs (all crypto loads) 8 events involving 4 loads in Central Texas 890 MW of ERCOT approved consumption 7 events involving 5 loads in 1st pocket in Far West Texas 410 MW of ERCOT approved consumption 4 events involving 3 loads in 2nd pocket in Far West Texas 345 MW of ERCOT approved consumption All consequential loss loss of line connecting loads during fault 4 events involving 11 loads in multiple pockets in Far West Texas 1,785 MW of ERCOT approved consumption 1 event involving single load in North load zone 264 MW of ERCOT approved consumption 7 PUBLIC
Large Power Electronic Load Ride-Through Events November 2023 - Present 8 PUBLIC
Central Texas Events Load Zone ERCOT Approved MW 345 390 65 800 345 390 65 800 345 390 65 800 345 390 65 800 345 390 65 90 890 345 390 65 90 890 345 390 65 800 345 390 735 Low Voltage at POI (pu & kV) 0.489 (138 kV)(A ) 0.489 (138 kV)(A ) 0.489 (138 kV)(A ) Pre-Disturbance Consumption (MW) 248 353.5 47.9 649.4 321.8 365.1 49.5 736.4 281.7 354.6 48.1 684.4 314.5 367.2 48.8 730.5 319.7 364.1 47.5 95.1 826.4 230 310.2 37.4 65.4 643 212.1 337.7 35.1 584.9 91.8 367.2 459 Post-Disturbance Consumption (MW) 125.6 239.3 24.7 Total Load Reduction (MW) 122.4 114.2 23.2 259.8 151.9 60.1 19.6 231.6 75.9 42.3 9.6 127.8 79.2 34.8 8.7 122.7 93.9 61.3 11.6 19.1 185.9 164.6 175.1 26.8 65.4 431.9 95 69.7 8.6 173.3 67.5 235.3 302.8 % Load Reduction 49.35 32.31 48.43 40.01 47.20 16.46 39.60 31.45 26.94 11.93 19.96 18.67 25.18 9.48 17.83 16.80 29.37 16.84 24.42 20.08 22.50 71.57 56.45 71.66 100.00 67.17 44.79 20.64 24.50 29.63 73.53 64.08 65.97 Date Fault Details Load Load Type Crypto Crypto Crypto LOAD A LOAD B LOAD C TOTAL LOAD A LOAD B LOAD C TOTAL LOAD A LOAD B LOAD C TOTAL LOAD A LOAD B LOAD C TOTAL LOAD A LOAD B LOAD C LOAD D TOTAL LOAD A LOAD B LOAD C LOAD D TOTAL LOAD A LOAD B LOAD C TOTAL LOAD A LOAD B TOTAL 345 kV line AG Fault 4 cycle clear 11/30/2023 South Crypto Crypto Crypto 0.486 (138 kV)(A ) 0.486 (138 kV)(A ) 0.540 (138 kV)(A ) 169.9 305 29.9 345 kV line AG Fault 4 cycle clear 12/23/2023 South Crypto Crypto Crypto 0.844 (138 kV)(C ) 0.844 (138 kV)(C ) 0.844 (138 kV)(C ) 205.8 312.3 38.5 345 kV line CG Fault 3 cycle clear 12/23/2023 South Crypto Crypto Crypto 0.523 (138 kV)(C ) 0.523 (138 kV)(C ) 0.523 (138 kV)(C ) 235.3 332.4 40.1 345 kV line CG Fault 3 cycle clear 12/24/2023 South Crypto Crypto Crypto Crypto 0.555 (138 kV)(C ) 0.559 (138 kV)(C ) 0.559 (138 kV)(C ) 0.572 (138 kV)(C ) 225.8 302.8 35.9 76 345 kV line CG Fault 3 cycle clear 3/29/2024 South Crypto Crypto Crypto Crypto 0.54 (138 kV)(PS) 0.54 (138 kV)(PS) 0.54 (138 kV)(PS) 0.00 (138 kV) 65.4 135.1 10.6 0 345 kV lines & 3LG Faults 5/22/2024 South Crypto Crypto Crypto 0.407 (138 kV)(A ) 0.403 (138 kV)(A ) 0.401 (138 kV)(A ) 117.1 268 26.5 138 kV line AG Fault 4 cycle clear 5/31/2024 South Crypto Crypto 0.405 (138 kV)(PS) 0.405 (138 kV)(PS) 24.3 131.9 138 kV line 3LG Fault 3 cycle clear 8/27/2024 South Reductions range from 17% - 67% of pre-disturbance consumption % reduction larger for 3LG faults (~65%) than for SLG faults (17% - 40%) 19% reduction seen for shallow voltage dip of 0.844 on single phase 9 PUBLIC
Central Texas LOAD B 8/27/2024 Event 10 PUBLIC
Far West Texas Events (1st Pocket) Low Voltage at POI (pu & kV) 0.00 (138 kV) 0.00 (138 kV) Load Zone ERCOT Approved MW 80 80 Pre-Disturbance Consumption (MW) 72.7 73.1 Post-Disturbance Consumption (MW) 0 0 Total Load Reduction (MW) 72.7 73.1 % Load Reduction 100.00 100.00 Date Fault Details 138 kV line Unknown fault type & clearing time Load Load Type Crypto Crypto LOAD F LOAD H 12/29/2023 West TOTAL LOAD E LOAD F LOAD G LOAD H LOAD I TOTAL LOAD E LOAD F LOAD G LOAD H LOAD I TOTAL LOAD E LOAD F LOAD G LOAD H LOAD I TOTAL LOAD E LOAD F LOAD G LOAD H LOAD I TOTAL LOAD E LOAD F LOAD G LOAD H LOAD I TOTAL LOAD E LOAD F LOAD G LOAD H LOAD I LOAD J TOTAL 160 130 80 80 80 40 410 130 80 80 80 40 410 130 80 80 80 40 410 130 80 80 80 40 410 130 80 80 80 40 410 130 80 80 80 40 36 446 145.8 53.4 69.5 65.1 63 33.4 284.4 55.5 66.8 67.1 67.2 33.5 290.1 52.9 63.3 60.5 62.7 32.6 272 31.4 62.7 67.2 62.1 34.1 257.5 80.2 63.6 63.2 61.3 31.9 300.2 110.8 68.7 68.4 67.8 34.4 31.5 381.6 145.8 41.4 69.5 65.1 63 7.9 246.9 43 5.5 67.1 67.2 6.7 189.5 32.9 63.3 60.5 62.7 7.6 227 7.5 62.7 67.2 62.1 8 207.5 80.2 63.6 63.2 61.3 6.9 275.2 23.4 68.7 68.4 67.8 7.7 4.6 240.6 100.00 77.53 100.00 100.00 100.00 23.65 86.81 77.48 8.23 100.00 100.00 20.00 65.32 62.19 100.00 100.00 100.00 23.31 83.46 23.89 100.00 100.00 100.00 23.46 80.58 100.00 100.00 100.00 100.00 21.63 91.67 21.12 100.00 100.00 100.00 22.38 14.60 63.05 0.356 (138 kV)(A ) 0.804 (138 kV)(PS) 0.804 (138 kV)(PS) 0.804 (138 kV)(PS) 0.804 (138 kV)(PS) Crypto Crypto Crypto Crypto Crypto 12 0 0 0 25.5 138 kV line AG Fault 3 cycle clear 4/6/2024 West 0.398 (138 kV)(A ) 0.866 (138 kV)(PS) 0.866 (138 kV)(PS) 0.866 (138 kV)(PS) 0.866 (138 kV)(PS) Crypto Crypto Crypto Crypto Crypto 12.5 61.3 0 0 26.8 138 kV line AG Fault 3 cycle clear 5/1/2024 West 0.384 (138 kV)(A ) 0.846 (138 kV)(PS) 0.843 (138 kV)(PS) 0.846 (138 kV)(PS) 0.843 (138 kV)(PS) Crypto Crypto Crypto Crypto Crypto 20 0 0 0 25 138 kV line AG Fault 3 cycle clear 6/17/2024 West 0.683 (138 kV)(B ) 0.010 (138 kV)(PS) 0.717 (138 kV)(PS) 0.010 (138 kV)(PS) 0.717 (138 kV)(PS) Crypto Crypto Crypto Crypto Crypto 23.9 0 0 0 26.1 138 kV line BG Fault 3 cycle 6/18/2024 West 0.380 (138kV)(B ) 0.716 (138 kV)(PS) 0.756 (138 kV)(PS) 0.716 (138 kV)(PS) 0.756 (138 kV)(PS) Crypto Crypto Crypto Crypto Crypto 0 0 0 0 25 138 kV line BG and BC Faults; 3-4 cycle clearing times 8/1/2024 West Crypto Crypto Crypto Crypto Crypto Crypto 0.305 (138 kV)(A ) 0.643 (138 kV)(A ) 0.628 (138 kV)(A ) 0.643 (138 kV)(A ) 0.628 (138 kV)(A ) 0.490 (138 kV)(A ) 87.4 0 0 0 26.7 26.9 138 kV line AG Fault 3 cycle clear 10/29/2024 West All 138 kV SLG faults with exception of one LL fault Missing single phase voltage data for several events Significant reduction in consumption for shallow positive sequence voltage dips; single phase voltage likely dipping below 0.7 pu at POIs causing reductions 11 PUBLIC
Far West LOAD F and LOAD H 10/29/2024 Event PMU data at POI towards two co-located sites; Change in line MW flow corresponds to reductions seen in load telemetry (~136 MW and 100% of pre-disturbance consumption) Similar performance seen for multiple events for Loads F,G,H, and I Possible phase balance of load protection within facilities? 12 PUBLIC
Far West Texas Events (Multiple Pockets) Low Voltage at POI (pu & kV) 0.08 (345 kV)(A ) 0.598 (138kV)(A ) 0.663 (138kV)(A ) 0.627 (138kV)(A ) N/A 0.589 (138kV)(A ) Pre-Disturbance Consumption (MW) 190.9 129.7 110 80.5 8 27.8 546.9 194 67.6 129.7 114 86.2 5.8 28.2 625.5 131.7 23.7 13.1 15.4 183.9 196.7 67.9 62.5 63.8 155.2 136.5 20.2 9 711.8 Load Zone ERCOT Approved MW 207 345 130 324 10 143 1159 207 80 345 130 324 10 143 1239 324 Post-Disturbance Consumption (MW) 105.6 118.5 100.4 73.4 6.3 27.4 Total Load Reduction (MW) 85.3 11.2 9.6 7.1 1.7 0.4 115.3 85.5 67.6 22.7 11.6 6.6 1.2 1.6 196.8 131 23.6 12.3 2.3 169.2 70.9 67.9 62.5 63.8 35.8 25.5 3.5 1.7 331.6 % Load Reduction 44.68 8.64 8.73 8.82 21.25 1.44 21.08 44.07 100.00 17.50 10.18 7.66 20.69 5.67 31.46 99.47 99.58 93.89 14.94 92.01 36.04 100.00 100.00 100.00 23.07 18.68 17.33 18.89 46.59 Date Fault Type Load LOAD K Crypto LOAD L LOAD E Crypto LOAD M Crypto LOAD N N/A LOAD O Crypto TOTAL LOAD K Crypto LOAD G Crypto LOAD L LOAD E Crypto LOAD M Crypto LOAD N N/A LOAD O Crypto TOTAL LOAD M Crypto LOAD R Crypto LOAD S Crypto LOAD P Crypto TOTAL LOAD K Crypto LOAD G Crypto LOAD F LOAD H Crypto LOAD Q Crypto LOAD L LOAD P Crypto LOAD N N/A TOTAL Load Type Crypto 345 kV; AG Fault; 4 cycle clear 11/8/2024 West 0.079 (345 kV)(B ) 0.728 (138kV)(B ) 0.595 (138kV)(B ) 0.652 (138kV)(B ) 0.632 (138kV)(B ) N/A 0.589 (138kV)(B ) 108.5 0 107 102.4 79.6 4.6 26.6 345 kV: BG Fault; 4 cycle clear Crypto 11/18/2024 West 0.7 0.1 0.8 13.1 0.09 (138 kV)(A ) 0.11 (138 kV)(A ) 0.11 (138 kV)(A ) N/A 138 kV: AG Fault; 4 cycle clear 1/17/2025 West 42 366 207 80 80 80 234 345 42 10 1078 125.8 0 0 0 119.4 111 16.7 7.3 0.682 (138 kV)(A ) 0.678 (138kV)(A ) 0.678 (138kV)(A ) 0.631 (138 kV)(A ) 0.603 (138 kV)(A ) 0.654 (138 kV)(A ) Crypto 345 kV; AG Fault; 4 cycle clear 1/29/2025 West Crypto 345 kV faults in West Texas affecting larger area and number of loads Events were all SLG faults; possible larger reductions for 3LG fault Multiple loads show reduced active power in faulted phase only Some affected loads involved in 2022-2023 events and had larger reductions Pre-disturbance load consumption for all LLI loads in West Texas was between1,300 and 1,400 MW for all events (table above is just affected loads that reduced consumption) 13 PUBLIC
Far West LOAD K 11/8/2024 Event Co-located with thermal generation; DFR data monitoring line to facility Increase in line flow of ~85 MW corresponds with load loss in telemetry (net injection from generation increased after load loss) Load balanced between all 3 phases immediately after fault clears 14 PUBLIC
Far West LOAD L 11/18/2024 Event DFR data directly monitoring load Load balanced before fault and unbalanced after fault Majority of load loss in faulted phase only 15 PUBLIC
Key Observations Large variance in % of reduction with similar voltage dips at POIB Some large PELs more sensitive to voltage disturbances than others Possible facility protection systems not visible to ERCOT nor included in dynamic models More information needed to understand partial trips/reductions SLG faults causing significant reductions for shallow positive sequence voltage dips Faulted phase likely reducing below ~0.7pu causing load reductions Single-phase high-resolution data required for analysis Data from facility (low side) would aid in analysis and understanding SLG faults far more common; 3LG faults will have bigger impact ~1,950 MW of operational large load in Far West Texas weather zone Additional ~2,600 MW in West Texas has been approved and have signed IAs ERCOT running studies to determine potential load loss in West Texas Preliminary assessment shows potential trip of many large loads with 3LG on 345 kV, assuming large loads trip below 0.75 pu at POIB Transmission improvements have limited impact to mitigate total reduction Other weaker grid areas may see similar events with projected large load growth 16 PUBLIC
Key Takeaways and Next Steps ERCOT Operations to continue monitoring and tracking large load ride-through events ERCOT Operations to continue working with TSPs to retrieve event data and ensure proper Disturbance Monitoring Equipment is in place Establish communication between ERCOT, TSPs, and load owners to evaluate ride-through performance of large PELs Potential NERC report on large load reduction events in ERCOT Challenges and issues to be addressed Determine actual ride-through capabilities of each type of large load Verify and validate load models for accurate representation of ride-through capabilities Develop reliability criteria through studies Examine potential ways to mitigate and/or minimize large load loss during fault events Difficulty performing event analysis without formal RFI process for loads 17 PUBLIC


")

")