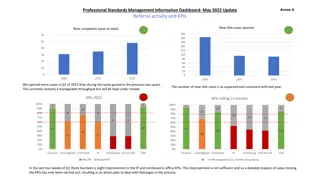
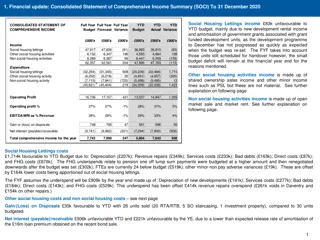
ESCO Implementation Update in EURES - December 2022
This update highlights the progress of ESCO implementation in EURES, focusing on mapping tables, adoption across countries, pending implementations, and issues related to technical standards. It covers enriching CVs and job vacancies with ESCO URIs, mapping of occupations and skills in various countries, and the importance of submitting mapping tables for continuous improvement. The update also discusses the state of encoding job vacancies with ESCO URIs for the third quarter of 2022. Stay informed about the latest developments in ESCO and EURES collaboration.
Download Presentation

Please find below an Image/Link to download the presentation.
The content on the website is provided AS IS for your information and personal use only. It may not be sold, licensed, or shared on other websites without obtaining consent from the author.If you encounter any issues during the download, it is possible that the publisher has removed the file from their server.
You are allowed to download the files provided on this website for personal or commercial use, subject to the condition that they are used lawfully. All files are the property of their respective owners.
The content on the website is provided AS IS for your information and personal use only. It may not be sold, licensed, or shared on other websites without obtaining consent from the author.
E N D
Presentation Transcript
How Well is the Nordic Model Functioning? Lars Calmfors Nordic Council: press lunch 28/10-2014
Background Study for the Nordic Council co-ordinated by ETLA in Finland: The Nordic Model Challenged but Capable of Reform Not so easy to define the Nordic Model
Net income replacement rate for short-term unemployed (first year), per cent
Challenges for the Nordic model 1. Maintain high productivity growth - lower productivity growth during the international crisis - falling productivity in Sweden and Norway already before the crisis - international debate 2. Financing of public services - ageing population - Wagner s law - Baumol s disease
Challenges for the Nordic model cont. 3. Employment - technological change reduces demand for low- skilled - globalisation - non-European immigrants 4. Income distribution - increasing inequality from a low level 5. Adjustment capability - Finland: Nokia, steel industry, forest industry
Unemployment in Sweden 2013 Total 8,0 15-19 r 20-24 r 25-34 r 35-54 r 55-64 r 32,1 14,0 5,6 3,7 3,8 Education Primary Secondary Tertiary 13,4 5,1 3,8 Country of origin Outside Europe Europe outside Sweden Sweden 16,0 8,7 5,2
How can challenges be met? 1. Productivity - combination of selective and general policies - subsidisation of researchers and researchers in the business sector rather than of research per se 2. Financing of public services - longer working life - retirement age should be indexed to life expectancy - earlier labour market entry for young people: graduation bonus dependent on age 3. Employment - school system: focus on weak pupils - higher wages for teachers and more wage dispersion in the profession - accept larger wage differentials (education cannot solve all problems) 4. Trade-off between efficiency and income distribuation objectives - wage differentials - tax system - Swedish Earned Income Tax Credit
Requirements on policy Improvements can be made in tax policy - property tax - equal taxation of capital income - uniform VAT Active labour market programmes - earlier focus: weak groups - new focus employers and matching
Differences in wage and PISA results(90/10) K llor: PISA 2014 och Eurostat Structure of Earnings Survey 2010
Wage dispersion in Sweden Percentilkvoter 2.20 2.20 2.00 2.00 1.80 1.80 1.60 1.60 1.40 1.40 1.20 1.20 96 98 00 02 04 06 08 10 12 P90/P10 P50/P10 P90/P50
Real disposable income for employed and non-employed in Sweden, respectively
