Establishing Institution-Set Standards and College Scorecard Review
Explore the importance of institution-set standards and the college scorecard in assessing student achievement and outcomes. Understand the metrics and goals set for enrollment management, student momentum, completion, guided pathways, and employment outcomes presented to the Planning & Budgeting Council. Discover the necessary updates and considerations for the college scorecard elements to drive continuous improvement.

Download Presentation

Please find below an Image/Link to download the presentation.
The content on the website is provided AS IS for your information and personal use only. It may not be sold, licensed, or shared on other websites without obtaining consent from the author. If you encounter any issues during the download, it is possible that the publisher has removed the file from their server.
You are allowed to download the files provided on this website for personal or commercial use, subject to the condition that they are used lawfully. All files are the property of their respective owners.
The content on the website is provided AS IS for your information and personal use only. It may not be sold, licensed, or shared on other websites without obtaining consent from the author.
E N D
Presentation Transcript
Institution Institution- -Set Standards and College Scorecard: Set Standards and College Scorecard: review of college goals, metrics, and outcomes review of college goals, metrics, and outcomes Presented to the Planning & Budgeting Council December 7, 2022 (slide 11 revised to include SYNC courses on Jan 3, 2023) By the Office of Planning, Research & Institutional Effectiveness
What are institution-set standards? ACCJC Standard I.B.3 states: The institution establishes institution-set standards for student achievement, appropriate to its mission, assesses how well it is achieving them in pursuit of continuous improvement, and publishes this information. Standards are the floor or minimum acceptable outcome Goals are what we are stretching or aspiring to achieve
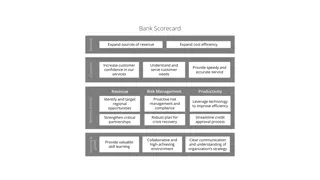
College Scorecard Elements Enrollment Management Student Momentum Student Completion Guided Pathways Students Employment Outcomes
College Scorecard Update Needed? Metrics derived from: Accreditation requirements Chancellor s Vision for Success ? 2019-22 Student Equity Plan (which was just updated ? 2020-23 Strategic Enrollment Management Plan (which we are in the process of updating) ? Metrics proposed and adopted in Fall 2020 which are difficult to operationalize/measure or might be reconsidered
Enrollment Management Student Headcount and Full-Time Equivalent Students (FTES) Average units attempted per student per academic year Goal: 9.8 36% 9.3 11,500 Goal: 11,124 37% 9.5 36% 10,982 9.0 11,000 10,776 8.9 10,744 8.8 35% 9.0 10,594 34% 10,313 10,500 34% 33% 8.5 34% 10,000 32% 8.0 9,602 7.9 31% 8.0 33% 31% 9,500 30% 30% 29% 7.5 9,000 28% 8,500 27% 7.0 2016-17 2017-18 2018-19 2019-20 2020-21 2021-2022 Fall 2022: 8.3 avg units taken Total students (unique headcount) FTES as % of Total Headcount indicates years affected by the COVID-19 pandemic
Home Campus Students 7,000 80% 6,223 74% 6,048 70% 6,000 5,619 66% 5,408 61% 60% 59% 5,000 4,104 50% 4,000 4,000 3,562 3,449 40% 3,000 30% 2,000 20% 1,000 10% 0 0% Fall 2019 Fall 2020 Fall 2021 Fall 2022 Total Students Enrolled at CAN CAN Home Campus Students % of All Students who are CAN Home Campus Note: Home campus is defined as a student with the goal of earning a degree, certificate, transfer, or completing their educational goal at Ca ada.
Enrollment Management 1,400 1,273 1,210 1,200 Goal: 1.196 1,139 1,168 1,120 1,121 1,000 800 600 Goal: 525 479 464 458 456 441 407 400 200 108 105 104 103 97 93 Goal: 109 - Avg Weekly Student Contact Cours (WSCH) per course section College-wide LOAD: WSCH/FTEF # of course sections 2016-17 2017-18 2018-19 2019-20 2020-21 2021-2022 indicates years affected by the COVID-19 pandemic
# Enrolled in Middle College Enrollment Management 130 Goal: 125 125 120 115 128 110 118 118 105 114 112 107 100 # of SUHSD high school graduates who enroll at CAN within one year of gradudation 95 2016-17 2017-18 2018-19 2019-20 2020-21 2021-2022 450 In our EMP and new MOU with Sequoia Union HSD, we have a new goal of doubling the size of Middle College to 206 by 2027. 400 Goal: 387 350 300 250 Our EMP calls for increasing dual enrollment opportunities for high school students (133 enrolled in Fall 2022!) and tripling the number of high school students on campus during the summer and on Saturdays during the academic year by 2027. 200 382 369 356 342 312 150 100 50 0 2017-18 2018-19 2019-20 2020-21 2021-2022 indicates years affected by the COVID-19 pandemic
Student Momentum: Persistence Fall to Spring Persistence Rates 80% 69% 70% 66% 65% Goal: 66% 60% 59% 60% 53% 52% 50% 50% 40% 30% 20% 10% 0% 2017-18 2018-19 2019-20 2020-21 2021-2022 All students Home campus students only indicates years affected by the COVID-19 pandemic
Student Momentum: Course Success Course Success Rates by Modality 85% 80% 80% Goal: 77% 75% 75% 75% 73% 73% 73% 73% 73% 73% 73% 72% 72% 72% 71% 71% 71% 71% 70% 70% 70% 68% 65% 60% Overall Online Hybrid Face to Face 2017-18 2018-19 2019-20 2020-21 2021-2022 indicates years affected by the COVID-19 pandemic
Disproportionately Impacted Students by Instructional Modality Face to Face Online Hybrid Synch AY 2021-22 Course Success Success Gap Enrollmen ts Course Success Success Gap Enrollmen ts 11924 Course Success Success Gap Enrollmen ts Course Success Success Gap Enrollmen ts OVERALL American Indian/Alaskan Native Asian Black - Non-Hispanic Filipino Hispanic Pacific Islander White Non-Hispanic Multi Races Unknown Female Male Unreported Low Income: No Low Income: Yes 80% PPG-1 2983 71% PPG-1 71% PPG-1 1184 68% PPG-1 7909 0 87% 89% 90% 72% 93% 88% 88% 81% 82% 79% 79% 82% 77% 7% 9% 10% -16% 13% 10% 8% 1% 3% -3% -2% 5% -5% 314 90 93 1348 30 717 240 140 1,501 1,411 82.00% 55.40% 71.90% 66.20% 70.30% 75.40% 78.70% 70.50% 71.50% 71.40% 76.10% 73.50% 66.90% 12% -17% 0% -9% -1% 5% 8% -1% 0% 0% 5% 7% -7% 1650 312 719 5127 182 2643 767 512 7165 4458 301 8472 3452 83% 61% 82% 76% 40% 86% 90% 70% 80% 78% 82% 81% 75% 4% 115 23 49 566 77.10% 55.70% 70.50% 64.50% 54.90% 78.80% 74.90% 67.20% 69.80% 64.10% 74.10% 67.20% 69.10% 8% 959 185 387 3584 91 1876 446 369 4822 2863 224 5680 2229 -19% 2% -6% -39% 9% 11% -10% 2% -3% 3% 7% -7% -15% 0% -10% -15% 11% 5% -3% 5% -6% 6% 1% -1% 5 269 78 76 694 462 28 825 359 71 2,127 856 = statistically significant differences
Student Momentum: transfer gateway course completion English 60% Math 53% 51% 49% 50% 50% 45% 45% 42% 45% 41% 39% 40% 40% 35% 33% 35% 30% 28% 30% 30% 25% 20% 20% 15% 10% 10% 5% 0% 0% 2019-20 2020-21 2021-2022 2019-20 2020-21 2021-2022 % of all students who completed transfer-level English at Ca ada in their first academic year of enrollment within the district % of all students who completed transfer-level math at Ca ada in their first academic year of enrollment within the district % of transfer-seeking, home campus students who completed transfer-level English at Ca ada in their first academic year of enrollment within the district % of transfer-seeking, home campus students who completed transfer-level Math at Ca ada in their first academic year of enrollment within the district
Student Completion: degrees & certificates Goal: 832 700 630 630 623 575 569 600 500 420 370 369 400 335 295 317 315 300 260 254 251 210 231 220 205 199 200 100 2017-18 2018-19 2019-20 2020-21 2021-2022 certificates awarded AA/AS degrees awarded ADT degrees awarded All Associates Degrees indicates years affected by the COVID-19 pandemic
Student Completion: time to completion 80 74 73 73 69 68.5 70 60 35 31 50 30 25 40 25 22 18 30 20 16 20 15 Median # of units earned among students who earned their first associate degree in the selected year and had completed at least 60 units 10 5 0 2017-18 2018-19 2019-20 2020-21 2021-2022 # of unduplicated students who earn an associate degree within 2 years (100% of normal time) 2017-18 2018-19 2019-20 2020-21 2021-2022 indicates years affected by the COVID-19 pandemic
Student Completion: # of online programs # of degrees available 100% online 45 42 40 35 30 25 20 15 10 7 4 4 5 0 0 2017-18 2018-19 2019-20 2020-21 2021-2022
Student Completion: transfers # of students who enrolled at a CSU or a UC Goal: 468 426 450 400 356 346 337 350 307 300 250 200 150 100 50 0 2017-18 2018-19 2019-20 2020-21 2021-2022 indicates years affected by the COVID-19 pandemic
Fall 2020 Institution-Set Standard Guided Pathway Metric Goal 2021-2022 2020-21 2019-20 2018-19 2017-18 # of Home Campus students 5,486 5,774 # of Home Campus students in an Interest Area 3,426 4,695 # of students in Art, Design, and Performance 479 748 # of students in Business 791 900 # of students in Human Behavior and Culture 1,002 1,556 # of students in Science and Health 1,224 1,592 # of students Undecided/University Transfer 2,574 1,266 % supported by ONLY success teams 29.9% 35.9% # of students served by Success Teams or Special Programs 3,051 3,598 % of all students supported by Success Teams or Special Programs 55.6% 62.3% # of students participating in non-curricular career exploration (COOP Ed, Field trips, Job Shadows, Internships) (only Coop listed here as other data is not available or not tracked centrally) 77 84 235 214 176 % of students "touched" by outreach who apply/enroll difficult to operationalize this metric % of first-time students participating in First Year Experience programs 5.0% 5.4% 3.7% % of Transfer Seeking Students supported by the Transfer Center, University Center and/or Success Teams or Affinity Groups (revise?) 100% % of Transfer Seeking Students supported by the Success Teams or Affinity Groups (revise?) % of Transfer Seeking Students supported by the Transfer Center, University Center (revise?) 100%
Student Employment Outcomes % of CTE students employed in the fourth quarter after exiting 102% 100% 100% 100% 98% 97% 96% 94% 93% 92% 92% 90% Goal: 89% 88% 2017-18 2018-19 2019-20 2020-21 2021-2022 Source: Annual survey of Career Technical Education program graduates (CTEOS)
First-Time Cohort Dashboard https://canadacollege.edu/prie/dashboards/ scorecard-enrollment.php