Estimating Household Food Waste with Scanner Data: Pros and Cons
This research explores estimating household-level food waste using scanner data, presenting the research plan, challenges, and methodological approach. The study utilizes USDA-ERS's FoodAPS data to investigate inefficiencies in turning purchased food into body mass-based output, employing techniques from production economics. The goal is to understand variations in food waste by household characteristics.

Download Presentation

Please find below an Image/Link to download the presentation.
The content on the website is provided AS IS for your information and personal use only. It may not be sold, licensed, or shared on other websites without obtaining consent from the author.If you encounter any issues during the download, it is possible that the publisher has removed the file from their server.
You are allowed to download the files provided on this website for personal or commercial use, subject to the condition that they are used lawfully. All files are the property of their respective owners.
The content on the website is provided AS IS for your information and personal use only. It may not be sold, licensed, or shared on other websites without obtaining consent from the author.
E N D
Presentation Transcript
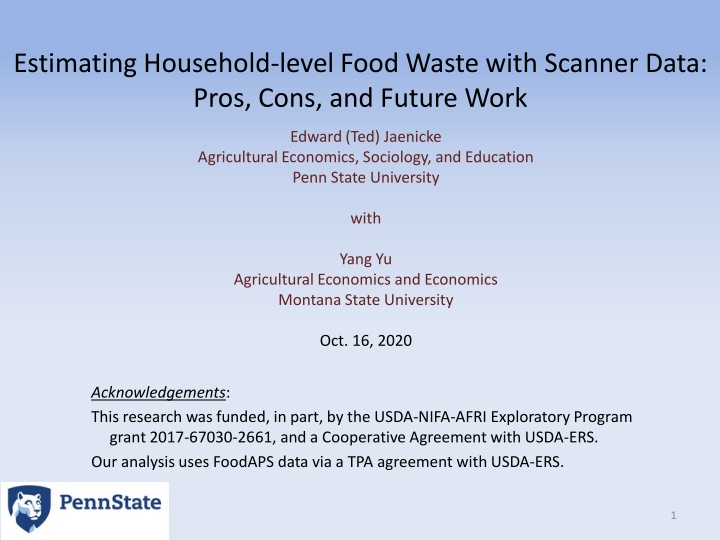
Estimating Household-level Food Waste with Scanner Data: Pros, Cons, and Future Work Edward (Ted) Jaenicke Agricultural Economics, Sociology, and Education Penn State University with Yang Yu Agricultural Economics and Economics Montana State University Oct. 16, 2020 Acknowledgements: This research was funded, in part, by the USDA-NIFA-AFRI Exploratory Program grant 2017-67030-2661, and a Cooperative Agreement with USDA-ERS. Our analysis uses FoodAPS data via a TPA agreement with USDA-ERS. 1
Background: Experienced with Food-Purchase Scanner Data, But New to Food Waste Previous research experience with three types of micro-level purchase data Retailer-level Nielsen and IRI data Weekly sales by product, by food retailers under contract with Nielsen or IRI. Nielsen Homescan and IRI Consumer Panel Data on all food purchased at food stores for home use; re-scanned at home by 100,000 commissioned panelists. Data on household characteristics (income, HH composition and demographics, etc.) Health data add-on for IRI IRI MedProfiler Data USDA-ERS FoodAPS One-week intense food survey/diary of all food purchased or acquired for home use or away from home. Data on Data on household characteristics (same as above, plus height and weight of all members) Challenge: Can we use this data to study food waste? Initial answer no, it s not observed in the data. Second answer maybe. 2
Estimating Food Waste at the Household Level The research plan Basis concept (1): Think of food waste as inefficiency in the production that converts HH-level purchased food into some sort of body mass-based output. This concept modeling a production process needs inputs and an output. Inputs can be quantities of food acquired, by food group, measured in grams or calories. Perhaps the best output is the metabolic energy required to maintain body weight. This energy requirement can be calculated with age, gender, height, and weight into. Some households are simply more efficient (i.e., less wasteful) in turning purchased food into metabolic energy.) We can use techniques from production economics to recover an inefficiency estimate (i.e., waste) after estimating the production process that reflects households abilities to convert inputs into outputs, relative to the most efficient individuals (on the frontier). 3
Estimating Food Waste at the Household Level The research plan Basis concept (2): More specifically, we Use USDA-ERS s FoodAPS data, for a complete record of food-at-home and food-away-from-home acquisitions (in a one-week period) for nine food groups. Use nutritional science concepts to calculate the food-energy needs for each household (to maintain a steady state body mass). Recover the estimate of output inefficiency, and convert it to input inefficiency, which is equivalent to food waste for each household. Investigate how the HH food-waste estimates vary by HH characteristic. 4
A Preview of our Results Using methods borrowed from production economics, we find that 31.9% of food purchased by households is not converted into energy (i.e., wasted), on average. Using FoodAPS sample weights and HH purchase info, this figure translates to $240 billion of food waste, annually. In addition, our research provides insights into behavior and/or determinants of HH-level food waste: HHs with higher income waste more. HHs with healthier diets waste more. Smaller HHs waste more. Food secure HHs waste more. SNAP participating HHs waste less. WIC receiving HHs waste less. Other: Pros and cons of our method. If time, we can also explore more variation in HH-level 5
Methods Household Production of Metabolic Energy We propose an output related to energy, Basal Metabolic Rate, calculated with the Harris-Benedict equations: Male: BMR = 88.362 + 13.397*weight + 4.799*height - 5.677*age Female: BMR = 447.593 + 9.247*weight+ 3.098*height - 4.33*age where members biological characteristics (bh) are composed of weight is measured in kilograms, height is in centimeters, and age is in years. BMR accounts for 50-70% of energy requirement, with a Physical Activity (PA) multiplier ranging fro 1 to 2.5, making up the rest. BMR * PA is the steady-state energy requirement. Thus, HH-acquired food produces HH s BMR, conditioned on PA and food waste. 6
Methods A Stochastic Production Frontier 1 Model 1: log? ? = log? ? ,? + log ?? + ? ? Model 2: log? ? = log? ? ,? + ????? Model 3: log? ? = log? ? ,? + log + ? ? ?? + ? ? Where ? (? ) = ?=1???(? ), ?? = physical activity, ? ? log? ? ,? = ?0+ ?=1 is the production frontier ? = quantity of food groups purchased by HH h. ? = white-noise error for HH h , i.e, ?(0,??2) ? = one-sided inefficiency term (waste) for HH h, i.e., ?+0,?? where ?? and? is a vector of HH characteristics that affect the mean and variance of inefficiency/waste, ??log??, ?=1 ? ???,?log??, log??, 2 , 2= exp(?0+ ? ??) 7
Methods A Stochastic Production Frontier 4 Post-Estimation Methods: The percentage of energy production waste (output inefficiency) is ? Percentage of food waste (input inefficiency): This is more complicated, and involves the correspondence between y and F (.), and requires additional assumptions: Assume, for now, that food in all I groups is wasted in the same proportion, ? . Solve for ? : ?0+ ?=1 ??log??, ?=1 ? ???,?log??, log??, ? = ?0+ ?=1 ??log(1 ? )??, ?=1 ? ???,?log(1 ? )??, log(1 ? )??, ? ? ? ? Thus, we estimate all the parameters (??, ??,?, and ? ) and solve for ? . This solution requires the quadratic formula. We keep the solution that makes economic sense, namely the one that is consistent with the notion that more output inefficiency implies more input inefficiency, i.e., food waste. 8
Data 1 FoodAPS Data: USDA-ERS s FoodAPS (almost 5,000 HHs) Seven-day intensive food diary and survey. Includes all food purchased or acquired for at-home, and away-from-home consumption. FoodAPS also has a full-suite of HH demographics and characteristic, including height, weight, and gender of each HH member. USDA already groups food into 9 categories and other uncoded items. HH purchases in these groups are entered as total grams (or total calories). Milk and Dairy Protein Foods Mixed Dishes Grains Snacks Fruits and Vegetables Beverages Condiments Infant Formula and Uncoded 1. 6. 2. 7. 3. 8. 4. 9. 5. 9
Data 2 Household BMR and Other Continuous Variables Notes: a) Food-group variables are measured in grams. b) Results are similar if measured in calories. c) Income is monthly income weighted by HH size 10
Data 3 HH Diet Healthiness and HH Food Security Diet Healthiness (Self-reported) HH Food Security (Self-reported) 11
Main Results 1: Percentage Food Waste (Due to the large number of parameters, I don t present the coefficient estimates) Model 1 (Baseline) Model 2 (with proxy for PA) Model 3 (with fitted PA) Average Food Waste 31.9% 31.1% 30.1% Standard Deviation 15.8% 17.1% 15.4% Distribution of output efficiency ? and food waste ? (Model 1) Note 1: A majority of HHs (about 70%) have waste estimates between 20% and 50%. Note 2: Even the most efficient HH still wastes about 8.7% 12
Main Results 2 Food Waste Determinants HH food waste increases with income, diet quality and food security. All three models show the same general relationship for food waste determinants. Conclusion: Results are robust to treatment of PA. 13
Post-Estimation Results 3 Food waste and HH income 14
Post-Estimation Results 4 Food waste and healthy diets (self-stated) 15
Post-Estimation Results 5 Relationship of HH-level food waste to HH characteristics Notable: Larger HHs waste less. HHs using a shopping list waste less. HHs driving farther distances to 10 store waste less. SNAP enrolled households waste less. Not shown: WIC enrolled households waste less. Obesity in HH linked to less waste. Share of food away from home has no impact. 16
Robustness, Validity, and Extendibility Robustness Results hold when the BMR is calculated with the Mifflin-St. Jeor equations. Sum of body weights is the output variable (rather than metabolic energy) Food inputs are measured in calories rather than grams. Validity When consumption data from NHAMES is used instead of acquisition data from FoodAPS is used, estimated food waste is near 0% (as expected). Thus, our results are not an artifact of the stochastic frontier estimation, but are driven by the data. Extendibility We re-ran the model without food-away-from-home acquisitions and found similar results. Thus, our technique could be used with most (larger) scanner datasets if we knew body weights. 17
Pros and Cons of this Stochastic Production Frontier Estimation Method Cons No physical activity. We think this isn t too worrisome, but No inventory or stockpiling data. We are assuming that HHs that stockpile cancel out HHs that draw down their food inventories, meaning deviations go in the white noise error term Steady-state body mass. We are assuming that any deviations of HH not maintaining steady-state body mass can likewise go in the white noise error term. Data intensive. Not only do we need all food acquisitions, but we also need personal characteristics (gender, age, height, and weight). No food-specific waste estimates. Converting output inefficiency to input inefficiency (food waste) is algebraically difficult, meaning for now we can only recover a single, aggregate food-waste estimate. Small sample size. The FoodAPS data has < 5,000 households. 18
Pros and Cons of this Stochastic Production Frontier Estimation Method Pros Robust to some specifications. As discussed. HH-level effects may be insensitive to the accuracy of the frontier estimation. Even if our estimate of the frontier is inaccurate, the relative position of individual HHs to the frontier is likely to be similar. Potential to use with the much larger IRI consumer panel. Since we find that omitting food away from home (in FoodAPS) has little impact, then other, bigger scanner data sets might be an option. If so, we gain a much larger N, And we also don t have to worry about inventories or stockpiling. Including additional information may let us estimate food-specific wastes. By incorporating additional information (such as prices), Yang is trying to estimate food-waste %s for food groups. 19
Thanks! Questions? Ted Jaenicke tjaenicke@psu.edu 20