Learn how to estimate proportions in polling, such as determining the percentage of a population with a certain property. Understand the trustworthiness of estimates, the trick to calculate proportions, choice of sample size, and the significance of margin of error in polling accuracy.
Please find below an Image/Link to download the presentation.
The content on the website is provided AS IS for your information and personal use only. It may not be sold, licensed, or shared on other websites without obtaining consent from the author. If you encounter any issues during the download, it is possible that the publisher has removed the file from their server.
You are allowed to download the files provided on this website for personal or commercial use, subject to the condition that they are used lawfully. All files are the property of their respective owners.
The content on the website is provided AS IS for your information and personal use only. It may not be sold, licensed, or shared on other websites without obtaining consent from the author.
E N D
Presentation Transcript
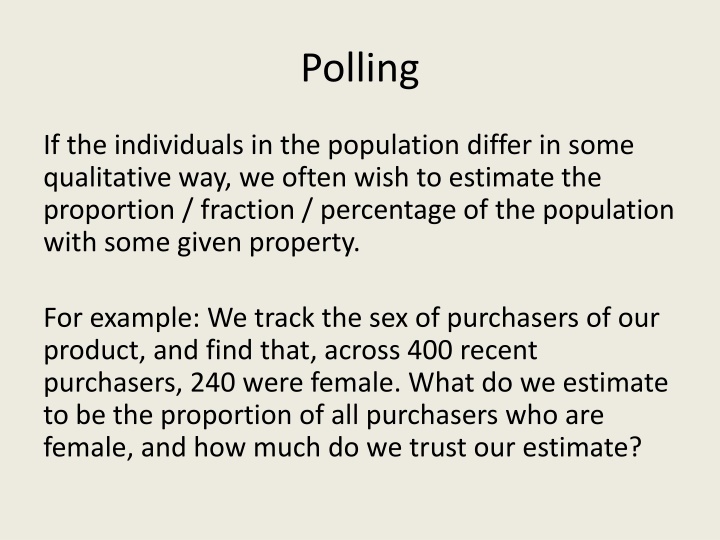
Polling If the individuals in the population differ in some qualitative way, we often wish to estimate the proportion / fraction / percentage of the population with some given property. For example: We track the sex of purchasers of our product, and find that, across 400 recent purchasers, 240 were female. What do we estimate to be the proportion of all purchasers who are female, and how much do we trust our estimate?
First, the Estimate 240 = 6 . 0 = = Let 400 p 60 % . Obviously, this will be our estimate for the population proportion. But how much can this estimate be trusted?
And Now, the Trick Imagine that each woman is represented by a 1 , and each man by a 0 . Then the proportion (of the sample or population) which is female is just the mean of these numeric values, and so estimating a proportion is just a special case of what we ve already done!
The Result s Estimating a mean: x (~ 2) n p ) p - (1 Estimating a proportion: p (~ 2) n [When all of the numeric values are either 0 or 1, s takes the special form shown above.] 0.6(1 - 0.6) 8 . 4 The example: 0.6 (~ 2) , or 60 % % . 400
Multiple-Choice Questions If the Republican Party s candidate were to be chosen today, which one would you most prefer? Romney, Cain, Bachman, Perry, Gingrich, Santorum, Paul, Huntsman, none The results are reported as if 9 separate yes/no questions had been asked. If the Republican Party s candidate were to be chosen today, which of these would have your approval? The same reporting method is used.
Choice of Sample Size Set a target margin of error for your estimate, based on your judgment as to how small will be small enough for those who will be using the estimate to make decisions. There s no magic formula here, even though this is a very important choice: Too large, and your study is useless; too small, and you re wasting money.
Estimating a Proportion: Polling Pick the target margin of error. Why do news organizations always use 3% or 4% during the election season? Because that s the largest they can get away with. p ) p - (1 0.5(1 - 0.5) 1 (~ 2) (~ 2) n n n So, for example, n=400 (resp., 625, or 1112) assures a margin of error of no more than 5% (resp., 4%, or 3%).
Estimating a Mean: Choice of Sample Size Set the target margin of error. s = Solve target = $25. s $180. Set n = 207. (~ ) 2 t arg et n From whence comes s? From historical data (previous studies) or from a pilot study (small initial survey).
The Square-Root Effect : Choice of Sample Size after an Initial Study Given the results of a study, to cut the margin of error in half requires roughly 4 times the original sample size. And generally, the sample size required to achieve a desired margin of error = 2 original margin of error ( ) original sample size desired m arg in of error
How to Read Presidential-Race Polls When reading political polls, remember that the margin of error in an estimate of the gap between the two leading candidates is roughly twice as large as the poll's reported margin of error. The margin of error in the estimated change in the gap from one poll to the next is nearly three times as large as the poll's reported margin of error.
Summary Whenever you give an estimate or prediction to someone, or accept an estimate or prediction from someone, in order to facilitate risk analysis be sure the estimate is accompanied by its margin of error: A 95%-confidence interval is (your estimate) (~2) (one standard-deviation s-worth of uncertainty inherent in the way the estimate was made) If you re estimating a mean using simple random sampling: s x (~ 2) n If you re estimating a proportion using simple random sampling: p ) p - (1 p (~ 2) n