Estimating Tropical Cyclone Intensity with Infrared Image Data
Estimating Tropical Cyclone Intensity and Genesis from Infrared Image Data. Analyzing data from the Atlantic and Gulf of Mexico using the Deviation-Angle Variance (DAV) technique. Methodology involves mapping DAV, variance maps of Hurricane Wilma, and DAV time series analysis correlating with NHC data. Intensity estimation using a sigmoid fit model, trained and tested on specific datasets.

Download Presentation

Please find below an Image/Link to download the presentation.
The content on the website is provided AS IS for your information and personal use only. It may not be sold, licensed, or shared on other websites without obtaining consent from the author.If you encounter any issues during the download, it is possible that the publisher has removed the file from their server.
You are allowed to download the files provided on this website for personal or commercial use, subject to the condition that they are used lawfully. All files are the property of their respective owners.
The content on the website is provided AS IS for your information and personal use only. It may not be sold, licensed, or shared on other websites without obtaining consent from the author.
E N D
Presentation Transcript
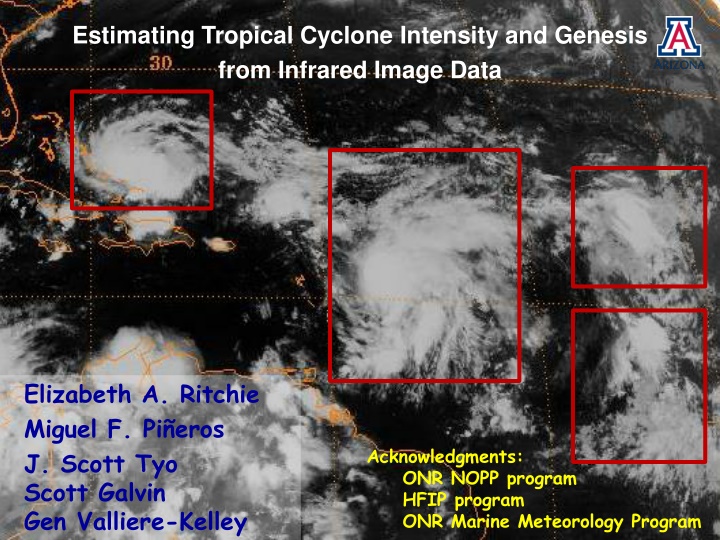
Estimating Tropical Cyclone Intensity and Genesis from Infrared Image Data Elizabeth A. Ritchie Miguel F. Pi eros J. Scott Tyo Scott Galvin Gen Valliere-Kelley Acknowledgments: ONR NOPP program HFIP program ONR Marine Meteorology Program
2. Data Atlantic and Gulf of Mexico: Infrared Imagery (GOES-E) 2004-2010 Spatial resolution: 5 km/pixel Temporal resolution: 30 min 10.7 m remove overland samples and cases outside the analysis region. Use the Deviation-Angle Variance (DAV) Technique to extract the genesis and intensity estimation signal
3. Methodology Artificial Hurricane BT gradient field Variance = 0 deg2 Map the DAV back to the reference pixel
3. Methodology Choose a different reference pixel and calculate the DAV
3. Map of Variances Hurricane Wilma (October 2005) 14 - 00UTC15 00UTC 15 - 1345UTC 16 00UTC 25kt 17 00UTC 30kt 17 06UTC 35kt 18 00UTC 55kt19 - 00UTC 130kt20 - 00UTC 135kt 21 - 00UTC 130kt 22 - 00UTC 120kt Extract the minimum value constrained by the cloud mass
3. DAV time series Genesis Intensity Correlation: - 0.93 NHC first best- track input 34 kt Hurricane Wilma 2005
3. DAV time series Genesis Intensity Correlation: - 0.93 Low points in the DAV signal Intensity: Map DAV values to BT intensities for all cases 2004-2009 training set (36TS 42H) NHC first best- track input Genesis: Accumulate statistics on cloud cluster positive detection versus false alarms for thresholds of DAV (every 50 deg2) 2004-2005 training set (3TD 1ST 17TS 20H 134NDCC) 34 kt
4. DAV Intensity estimation Fit is a sigmoid constrained at both ends Training: 2004-2009 Two tests: 1. Train using 2004-2008. Test with 2009 (8 cases) 2. Train using 2004-2009. Test with 2010 (14 cases)
4. DAV Intensity estimation Fit is a sigmoid constrained at both ends Training: 2004-2009 Two tests: 1. Train using 2004-2008. Test with 2009 (8 cases) 2. Train using 2004-2009. Test with 2010 (14 cases) RSME = 24.8 kt RSME = 13.8 kt
4. DAV Intensity estimation Training 2004-2008 Testing 2009: RMSE = 24.8kt !!
4. DAV Intensity estimation Training 2004-2008 Testing 2009: RMSE = 24.8kt !! Remove these 2 cases: RMSE = 12.9 kt!! ** Over-estimate of sheared systems with very circular, offset CDOs Erika
5. Laundry list 1. Fix shear issue : constrain the DAV value using operational center fixes: 2010 test: RMSE = 13.04 kt. 2. Fit only to periods when USAF recon is available 3. Other Basins: processing ePac (UA) and wPac (NRL): (in progress) 4. Low wind speeds: limited BT intensity estimates: - use mesoscale model to build simulated best track archive (in progress) - query USAF recon database for low wind speed observations and fit to those 5. Put confidence on estimates: - bin by cloud scene type - bin by intensity intervals - bin by environmental conditions
6. DAV Genesis Prediction Genesis Intensity Low points in the DAV signal NHC first best- track input Genesis: Accumulate statistics on cloud cluster positive detection versus false alarms for thresholds of DAV (every 50 deg2) 2004-2005 training set (3TD 1ST 17TS 20H 134NDCC)
6. DAV Genesis Prediction ROC curve for IR imagery (2004-2005) 1 1650 0.9 2000 1850 1900 170017501800 1950 0.8 True Positive Rate 1600 0.7 1550 1500 Variance Thresholds 0.6 1400/1450 0.5 1350 0.4 0.3 0.2 0.1 0.00 0.10 0.20 0.30 0.40 0.50 0.60 0.70 0.80 0.90 1.00 False Alarm Rate
6. DAV Genesis Prediction 50 40 TPR = 93% FAR = 22% Mean Median 30 20 TPR = 96% FAR = 40% 10 Time [h] 0 -10 Mean = -0.6 h -20 Mean = -12 h -30 -40 1350 1400 1450 1500 1550 Variance Threshold [deg2] 1600 1650 1700 1750 1800 1850 1900 1950 2000 Bottom Line: * Right now can make a deterministic Yes/No prediction * Turning into a probability of TD in 24-, 48-, and 72-h prediction * Developed a user interface GUI that automatically tracks and labels with DAV thresholds when they are met.
7. Summary A completely objective and independent technique to estimate TC intensity andpredict genesis. Currently uses only IR 10.7 m channel Intensity: testing gives results between RMSE 13-14 kt Intensity: gave the laundry list of future development - also to test 3.9, 6.7, 12 m channels and polar-orbiting MW channels presents its own unique challenge Genesis: there is also a laundry list. - developing for ePac and wPac - have already tested 6.7 water vapor m channel and not found new/additionalinformation to improve FAR and time to detection - plan to test 3.9, 12 m channels and MW channels
Thank you Pi eros, M. F., E. A. Ritchie, and J. S. Tyo 2008: Objective measures of tropical cyclone structure and intensity change from remotely-sensed infrared image data. IEEE Trans. Geosciences and remote sensing. 46, 3574-3580. Pi eros, M. F., E. A. Ritchie, and J. S. Tyo 2010: Detecting tropical cyclone genesis from remotely-sensed infrared image data. IEEE Trans. Geosciences and Remote Sensing Letters, 7, 826-830. Pi eros, M. F., E. A. Ritchie, and J. S. Tyo 2011: Estimating tropical cyclone intensity from infrared image data. Wea. Forecasting, (In review). Valliere-Kelley, G., E. A. Ritchie, M. F. Pineros, and J. S. Tyo: Tropical cyclone intensity estimates using the Deviation-Angle Variance Technique: Part I. Statistics for the 2009- 2011 seasons based on intensity bins. Wea. And Forecasting, (In Preparation).
4. DAV Intensity estimation Training 2004-2009 Testing 2010: RMSE = 13.8kt !!