Estuary Trends in Weather and Water Quality Monitoring
"Explore the National Estuarine Research Reserve System's continuous monitoring program to track estuary health, water quality trends, and weather impacts. Learn about the importance of water quality and how weather influences estuarine ecosystems."

Download Presentation

Please find below an Image/Link to download the presentation.
The content on the website is provided AS IS for your information and personal use only. It may not be sold, licensed, or shared on other websites without obtaining consent from the author. If you encounter any issues during the download, it is possible that the publisher has removed the file from their server.
You are allowed to download the files provided on this website for personal or commercial use, subject to the condition that they are used lawfully. All files are the property of their respective owners.
The content on the website is provided AS IS for your information and personal use only. It may not be sold, licensed, or shared on other websites without obtaining consent from the author.
E N D
Presentation Transcript
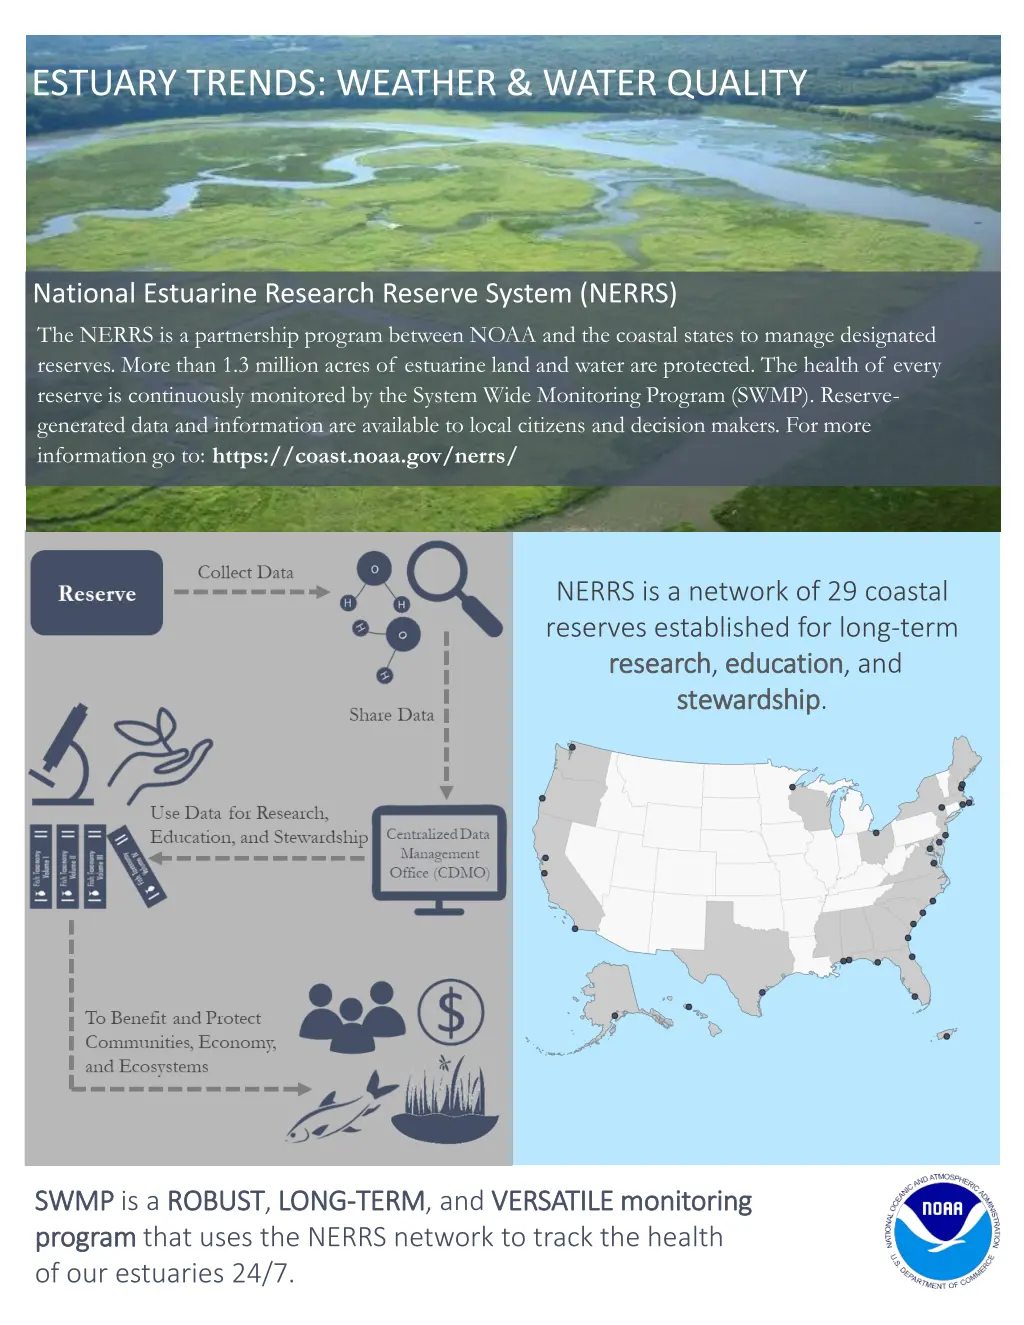
ESTUARY TRENDS: WEATHER & WATER QUALITY National Estuarine Research Reserve System (NERRS) The NERRS is a partnership program between NOAA and the coastal states to manage designated reserves. More than 1.3 million acres of estuarine land and water are protected. The health of every reserve is continuously monitored by the System Wide Monitoring Program (SWMP). Reserve- generated data and information are available to local citizens and decision makers. For more The NERRS is a partnership program between NOAA and the coastal states to manage designated reserves. More than 1.3 million acres of estuarine land and water are protected. The health of every reserve is continuously monitored by the System Wide Monitoring Program (SWMP). Reserve- generated data and information are available to local citizens and decision makers. For more information, go to: https://coast.noaa.gov/nerrs/ information go to: https://coast.noaa.gov/nerrs/ NERRS is a network of 29 coastal reserves established for long-term research research, education education, and stewardship stewardship. SWMP SWMP is a ROBUST program program that uses the NERRS network to track the health of our estuaries 24/7. ROBUST, LONG LONG- -TERM TERM, and VERSATILE VERSATILE monitoring monitoring
Recent Trends in Water Quality* Ortho-phosphate Diss. Inorganic Nitrogen Chlorophyll-a Dissolved Oxygen Reserve LOC 1 x x x LOC 2 x x LOC 3 x x LOC 4 x x LOC 1 x x x x x LOC 2 x x x x LOC 3 x x x x x LOC 4 x x x x LOC 1 x x x LOC 2 x x LOC 3 x x LOC 4 x x LOC 1 x x LOC 2 x LOC 3 x LOC 4 x x Ashepoo Combahee Edisto Basin Apalachicola Bay Chesapeake Bay - MD Chesapeake Bay - VA Delaware Elkhorn Slough Grand Bay Great Bay Guana Tolomato Matanzas He'eia Hudson River Jacques Cousteau Jobos Bay Kachemak Bay Lake Superior Mission-Aransas Narragansett Bay North Inlet-Winyah Bay North Carolina Old Woman Creek Padilla Bay Rookery Bay Sapelo Island San Francisco Bay South Slough Tijuana River Wells Weeks Bay Waquoit Bay Increasing Not Changing Insufficient Data Decreasing X *Based on data collected from 2007-2016, LOC = Sample Location Weather and Climate What is the Difference? What is Water Quality? Itdescribes the condition of water in terms of its chemical, physical, and biological characteristics. Measuring water quality can include several factors such as water temperature, the amount of salt (or salinity), the concentration of nitrogen and phosphorus (nutrients), the concentration of dissolved oxygen, etc. The quality of the water is usually evaluated in terms of its suitability for a specific purpose such as fishing, or swimming. WEATHER is what you see outside on any particular day in terms of precipitation, temperature, humidity, cloudiness, visibility and wind. CLIMATE tells us the average daily weather for an extended period of time (years, decades, centuries) at a certain location.
Weather can have a major impact on water quality Weather data helps scientists and managers understand water circulation Weather data helps scientists and managers understand water circulation patterns, plant growth, shellfish patterns, plant growth, shellfish and fish and fish distribution, storm frequency intensity intensity and and much more much more distribution, storm frequency and and Trends in Precipitation Precipitation is not changing at most reserves within the NERRS system. However, there are a few exceptions. A decreasing trend has been observed at two reserves in the northeast, and an increasing trend has been observed at two reserves in the southeast and at the reserve located in Alaska. A decreasing trend means it is getting dryer and an increasing trend means it is getting wetter. Increasing No Trend Insufficient Data X Decreasing *Based on data collected from 2007-2016 Trends in Air Temperature Air temperature is increasing at four out of the five west coast reserves in the NERRS. system. An increasing trend has also been observed at two reserves in the southeast and at the reserves located in Puerto Rico and Alaska. Air temperature at the other reserve locations is not changing. An increasing trend means it is getting hotter and an decreasing trends means it is getting cooler. No Trend X Insufficient Data Increasing Decreasing *Based on data collected from 2007-2016
Tracking The Health of Our Estuaries 24/7 SWMP helps reserves track and understand how human activities and natural events affect coastal habitats. Automated data loggers are used to monitor the temperature, depth, salinity, dissolved oxygen, turbidity, and pH of each estuary s water, every 15 minutes, at all 29 NERRS sites. Each reserve also reports real-time data online from at least one water quality sampling location. Every month, the reserves also sample the water for nutrients (nitrogen and phosphorus) and chlorophyll a. Weather can have a major impact on water quality in estuaries. Every reserve has a weather station that collects data every 15 minutes. Data are reported in real-time and available online for air temperature, relative humidity, atmospheric pressure, rainfall, and wind speed and direction. For more information, go to: https://coast.noaa.gov/estuaries/science-data/ Water Quality Terms: Nutrients: Rainwater runs off the land bringing nutrients, like nitrogen and phosphorus, into rivers too many nutrients can cause harmful algal blooms. Providing the science needed for today and tomorrow Algae: Simple, plant-like organisms that that live in the freshwater and ocean they can grow out of control and produce harmful effects on people, fish, shellfish, marine mammals and birds. Dissolved Oxygen: Underwater life needs oxygen to survive. Low levels are stressful or even fatal. For Scientists Access data at the Central Data Management Office (CDMO) website: http://www.nerrsdata.org/ For Stakeholders Access data at the SWMP Graphing Application website: https://coast.noaa.gov/swmp/ Have Questions? Contact NOAA first.last@noaa.gov (555) 555-1212