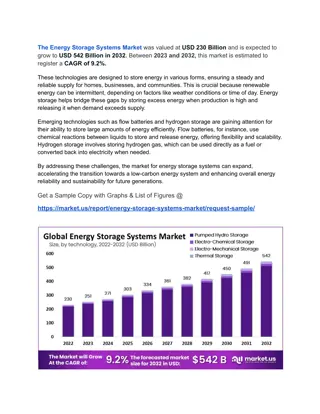
Explore the EU's long-term strategy for electricity storage and achieving carbon neutrality by 2050. The presentation discusses various aspects such as power generation from renewables, electricity and gas shares, carbon removal technologies, and investment costs for electricity storage technologies.
Please find below an Image/Link to download the presentation.
The content on the website is provided AS IS for your information and personal use only. It may not be sold, licensed, or shared on other websites without obtaining consent from the author. If you encounter any issues during the download, it is possible that the publisher has removed the file from their server.
You are allowed to download the files provided on this website for personal or commercial use, subject to the condition that they are used lawfully. All files are the property of their respective owners.
The content on the website is provided AS IS for your information and personal use only. It may not be sold, licensed, or shared on other websites without obtaining consent from the author.
E N D
Presentation Transcript
ELECTRICITY STORAGE WITHIN THE EU LONG- TERM STRATEGY Prof. Pantelis CAPROS October 24, 2019 The presentation reflects purely personal opinions
Carbon neutrality by 2050 Power Power GHG Emissions (Gt CO2 GHG Emissions (Gt CO2- -eq.) eq.) 5.1 5.1 Industry Industry 4.6 4.6 Transport Transport 4.3 4.3 Tertiary Tertiary 4.0 4.0 Including LULUCF emission sink, the 1.5o strategy variants achieve carbon neutrality of the EU by 2050 and beyond 3.5 3.5 Residential Residential - 1 492 Mt Non-CO2 Non-CO2 2.9 2.9 Carbon removal Carbon removal technologies technologies Net emissions Net emissions The carbon removal technologies are BioCCSand CCUS 1.9 1.9 - 2 665 Mt Negative emissions, albeit small in magnitude, compensate for few remaining GHG emissions in 2050 (from agriculture, gas combustion and process emissions) 1.0 1.0 0.5 0.5 0.2 0.2 2 2005 2005 2010 2010 2015 2015 2020 2020 2025 2025 2030 2030 2035 2035 2040 2040 2045 2045 2050 2050
Electricity and Gas shares EU28 Shares in final energy consumption (2050) Direct electricity Electricity-based fuels 73% 70% Total electricity 60% 55% 49% Electricity dominates energy supply both directly in final demand and as feedstock for H2 and e-fuels 40% The dominant role of electricity is common feature of all 1.5oC strategies irrespective of the focus EU 2030 targets Efficiency for 2oC Electrification for 2oC GHG-neutral fuels for 2oC Supply focus for 1.5oC Demand focus for 1.5oC Natural gas Synthetic or bio gases All gaseous fuels Shares in energy consumption (2050) The share of gaseous fuels slightly decreases over time, with natural gas dropping dramatically, especially in the 1.5oC strategies 25% 24% 20% 19% 18% 17% Independence from natural gas and oil imports is an impressive game changer EU 2030 targets Efficiency for 2oC Electrification for 2oC GHG-neutral fuels for 2oC Supply focus for 1.5oC Demand focus for 1.5oC 3
Renewables in Power Generation EU28 % of total power generation Power generation by renewables (TWh) 7 000 84% 6 000 All strategy variants foresee renewables up to 85% by 2050 (70% for variable RES), much above the 30% in 2015 and 55% in 2030. 73% 5 000 202% 4 000 RES increase at the same pace as total demand for electricity, including for production of H2 and e-fuels 3 000 59% 2 000 The GHG-neutral fuels strategy doubles RES compared to the efficiency strategy. The new carriers strategy increase RES by 50%. 1 000 0 2010 2015 2020 2025 2030 2035 2040 2045 2050 The 1.5oC need very high RES irrespective of the demand or supply focus EU 2030 targets Efficiency for 2oC New carriers for 2oC 4 GHG-neutral fuels for 2oC Supply focus for 1.5oC Demand focus for 1.5oC
Electricity Storage Technologies Investment cost per unit of capacity (EUR/kW) Levelized total cost in EUR of a MWh stored 2030- 35 2040 -50 2030 -35 2040- 50 Efficiency (%) Storage cycle 2020 2020 Compressed Air Energy Storage Hours- Days 1100 880 694 80 225 192 172 Storage cycle Flywheel 1500 1200 662 85 1127 905 511 Minutes Months Power-to-X H2, e-gas Large-scale batteries 2230 1500 957 94 129 101 80 Hours Days Small-scale batteries 1125 760 588 94 99 81 72 Hours Hydro-pumping Hours Hydro-Pumping 1100 935 915 83 102 94 93 Hours Small Batteries Large-scale Batteries Minutes Electrolysis (cost of H2) 1200 700 350 82 84 73 65 Flywheels Supercapacitors Full storage cycle H2 52 133 116 104 All cycles Seconds 10 100 1000 0.1 1 Nat. Gas balancing incl. ETS (from 25 up to 100 EUR/tCO2) 550 500 450 60 69 79 108 All cycles 5 Capacity (MW)
Electricity storage outlook EU28 Power storage capacity in 2050 (GW) Hydro pumping efficiency & electrification cases 67 137 59 14% Batteries Storage and interconnections, rather than gas plants, provide the large flexibility and reserve needs of the system due to RES Power-to-X hydrogen strategy 54 97 341 21% Share of storage capacity over power capacity Mainly batteries (various scales and system levels) provide storage in the efficiency and electrification variants GHG-neutral fuels strategy 57 95 566 28% Large chemical storage in variants with H2 and e-fuels, enable maximum exploitation of renewables despite the significant increase on total electricity generation 1.5oC strategies 52 63 586 27% 6
Regulatory issues Market issues Small-scale batteries (behind the meter) soon competitive 1. Unbundling and Ownership by network operators 2. When at a system level, issue of essential facility may arise System-scale batteries and pumping unlikely to be profitable based on market price arbitraging 3. When behind the meter, fully private and un- regulated They could be profitable if they balance virtual power plant portfolios based on RES addressing the retail market 4. RES-certification for absorption of energy from the grid Uncertainty discourages pure-private investment in large-scale storage even for large market actors 5. Virtual power plant in the target model markets Power-to-X is attractive in the long-term under high cost of CO2 6. Grid fees and levies 7. Participation in flexibility and capacity markets Heavily depends on costs of electricity feedstock RES certification is crucial for eligibility 7