European Service Industries in International Trade Negotiations: Importance of Services Trade
Discover how the European Service Industries play a crucial role in international trade negotiations, particularly focusing on the significance of trade in services between the EU and South Korea. Explore data showcasing the high percentage of trade in services in the EU GDP compared to other countries, the EU's position as the top global exporter of services, and the key trading partners in services. Delve into the comparison between Balance of Payments (BoP) and Trade in Value Added (TiVA) for both the EU and South Korea, highlighting the vital role of trade in services in fostering economic growth.
Uploaded on | 1 Views
Download Presentation

Please find below an Image/Link to download the presentation.
The content on the website is provided AS IS for your information and personal use only. It may not be sold, licensed, or shared on other websites without obtaining consent from the author. If you encounter any issues during the download, it is possible that the publisher has removed the file from their server.
You are allowed to download the files provided on this website for personal or commercial use, subject to the condition that they are used lawfully. All files are the property of their respective owners.
The content on the website is provided AS IS for your information and personal use only. It may not be sold, licensed, or shared on other websites without obtaining consent from the author.
E N D
Presentation Transcript
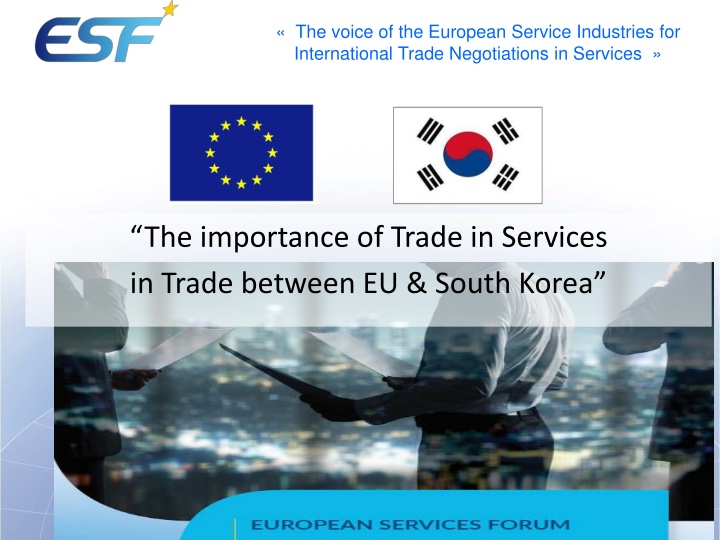
The voice of the European Service Industries for International Trade Negotiations in Services The importance of Trade in Services in Trade between EU & South Korea
The voice of the European Service Industries for International Trade Negotiations in Services The share of Trade in Services in the EU GDP is higher than in other high income countries! 27.3% (14.2% in South Korea) Trade in Services (GDP) (%) 30 European Union High Income Middle Income Low Income South Korea 27.3 25 20 18.3 16.3 16.3 15 14.2 12.8 13.5 11.7 10 8.2 8.4 5 0 2009 2010 2011 2012 2013 2014 2015 2016 2017 2018 2019 Source: World Bank 2020 IBRD-IDA
TOP 15 WORLD EXPORTERS The voice of the European Service Industries for International Trade Negotiations in Services OF TRADE IN SERVICES 2526 2182 2000 2015 2016 2017 EU is the first largest global exporter of services 2018 2019 1500 1123 1000 853 South Korea is the 9th largest global exporter of services 500 416 282 214 205 201 120 101 101 99 82 72 69 62 0 Total World Export of services 2019= 5007 Bio US$ - Source: WTO Trade Statistical Review 2020 Bio US$
TOP 20 EU TRADING PARTNERS IN SERVICES TOP 20 EU TRADING PARTNERS IN SERVICES The voice of the European Service Industries for International Trade Negotiations in Services (EXTRA (EXTRA- -EU27) EU27) 2019 2019 - - BIO BIO 224.2 221.5 EU27 Exports EU27 Imports 205 200 180.8 SOUTH KOREA IS THE EU 17TH TRADING PARTNER IN SERVICES 150 113.6 65.2 100 32.7 52.4 25.916.2 50 14.7 17.4 30.830.827.226.321.718.114.815.613.912.514.913.8 139.25.1 5.3 5.3 13.77.9 7.9 11.411.913.8 6.2 4 2.2 2.2 12.6 7.9 7.3 0 Source: Eurostat bop_its6_det.
The voice of the European Service Industries for International Trade Negotiations in Services IMPORTANCE OF TRADE IN SERVICES Comparison between BoP & TiVA EU Exports in TiVA - 2016 - % EU27 Exports in BOP - 2019 Bio $ 32% 68% 1123 41.7 58.3 2386 Goods Services Goods Services Total Export EU= 3509 $Bio Source: WTO WTS2020 & OECD TiVA
The voice of the European Service Industries for International Trade Negotiations in Services IMPORTANCE OF TRADE IN SERVICES in South Korea Comparison between BoP & TiVA South Korea Exports in BOP - 2019 BioUS$ South Korea Exports in TiVA - 2016 - % 15,7% 84,3% 101 35.8 64.2 542 Goods Services Goods Services Total Export South Korea = 643 Bio Source: WTO WTS2020 & TiVA
The voice of the European Service Industries for International Trade Negotiations in Services EU27-South Korea Trade (Imports and exports of goods & services) Trade in Goods ( Mio) 14000 Trade in Services ( Mio) 13029 50000 12363 47426 45291 46056 44035 44104 43508 4375943350 11154 10778 11309 41382 12000 38800 40000 35576 34648 10000 30000 8000 7349 7011 6990 6492 6346 5680 20000 6000 5373 4808 4297 4285 4000 10000 5806 4153 2000 1186 0 -527 2015 2016 2017 2018 2019 2020 0 -2296 -4046 2015 2016 2017 2018 2019 -10000 EU Imports EU Exports Balance EU Imports EU Exports Balance Source: Eurostat - ext_lt_maineu + bop_its6_det.
The voice of the European Service Industries for International Trade Negotiations in Services EU27-South-Korea Trade Trade in Services ( Mio) +91% increase of EU Exports since 2011 +83% increase of EU Imports since 2011 14000 13029 11154 12363 12000 11309 9851 10778 8886 10000 7547 6804 8000 7349 7011 6990 6492 6346 5769 5680 6000 5373 4959 4808 4297 4285 4013 4006 3926 4081 3541 4000 2791 2000 0 2011 2012 2013 2014 2015 2016 2017 2018 2019 EU Imports EU Exports Balance Source: Eurostat -bop_its6_det.
The voice of the European Service Industries for International Trade Negotiations in Services IMPORTANCE OF TRADE IN SERVICES IN THE EU IMPORTANCE OF TRADE IN SERVICES IN THE EU- -SOUTH Services represents only 18.6% of the total trade between EU & Services represents only 18.6% of the total trade between EU & South Korea, one of the lowest level among OECD countries South Korea, one of the lowest level among OECD countries (22.4% of EU exports to South Korea = Services) (22.4% of EU exports to South Korea = Services) SOUTH KOREA KOREA TRADE RELATIONSHIP TRADE RELATIONSHIP EU27 Exports to South Korea 2019 Mio - % South Korea Exports to EU27 2019 Mio - % EU27 & South Korea Total volume of trade 2019 Mio - % 18.6% 18.6% 77.6% 77.6% 14.3% 14.3% 85.7% 85.7% 81.4% 81.4% 22.4% 22.4% 7349 20378 13029 44104 89395 45291 Goods Services Goods Services Goods Services Total: 58 320 Mio Total: 51 453 Mio Total: 109 773 Mio Source: Eurostat - ext_lt_maineu + bop_its6_det.
The voice of the European Service Industries for International Trade Negotiations in Services EU27 and UK Trade in Services with South Korea ( Mio) 14,000 13,029 12,000 12,363 11,154 11,309 10,778 10,000 9,851 8,886 8,000 7,011 6,492 6,990 7,349 7,547 6,346 5,769 6,804 6,000 4,959 4,006 4,013 4,000 3,102 2,865 2,490 2,318 2,380 1,909 1,760 1,454 2,000 1,077 886 1,237 1,012 1,117 805 654 498 641 771 0 2011 2012 2013 2014 2015 2016 2017 2018 2019 EU Exports EU Imports UK Exports UK Imports
The voice of the European Service Industries for International Trade Negotiations in Services EU28* Services Exports and Imports to Singapore per sectors (2018 - Million) 12000 Exports - Total 34 531 Imports - Total: 26 328 11390 33% of EU28 Exports 10000 21.7 % 22% 8000 7615 7603 7488 6000 6411 4874 4863 4000 6.7% 7.8% 2.6% 2690 2000 2348 1078 503 221 298 341 897 587 128 152 473 80 92 50 21 43 0 Source: Eurostat 2019 Note: Other business services comprise mainly: research and development, professional and management consulting services, technical, trade-related services. EU27 figures not available yet.
The voice of the European Service Industries for International Trade Negotiations in Services EU Exports of services to Singapore per countries (Extra EU27) - Mio 2018 9000 8708 8500 8000 7500 7000 6500 6000 5373 5500 5000 4107 4500 4000 3702 3500 3000 2143 2500 1238 2000 1170 1500 1045 361 277 549 424 1000 75 22 60 180162141 27 264 6966 14 500 65 28 35 9 0 Source: Eurostat bop_its6_det.


