Evaluating a New Policing Strategy and Organizational Barriers
Explore the challenges in traditional policing methods and the need for innovative strategies to reduce crime effectively. This research delves into the disconnect between current practices and policy goals, emphasizing the importance of proactive, community-oriented policing approaches for enhancing public trust and legitimacy. Discover potential solutions for improving policing outcomes and organizational design.
Download Presentation

Please find below an Image/Link to download the presentation.
The content on the website is provided AS IS for your information and personal use only. It may not be sold, licensed, or shared on other websites without obtaining consent from the author. If you encounter any issues during the download, it is possible that the publisher has removed the file from their server.
You are allowed to download the files provided on this website for personal or commercial use, subject to the condition that they are used lawfully. All files are the property of their respective owners.
The content on the website is provided AS IS for your information and personal use only. It may not be sold, licensed, or shared on other websites without obtaining consent from the author.
E N D
Presentation Transcript
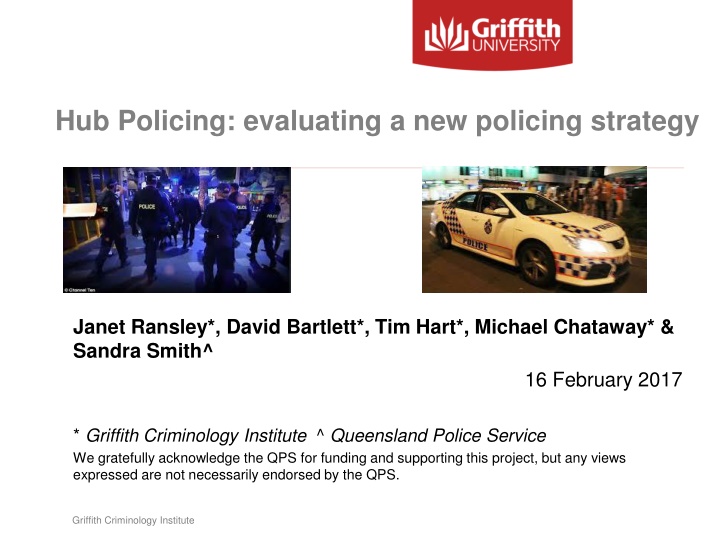
Hub Policing: evaluating a new policing strategy Janet Ransley*, David Bartlett*, Tim Hart*, Michael Chataway* & Sandra Smith^ 16 February 2017 * Griffith Criminology Institute ^ Queensland Police Service We gratefully acknowledge the QPS for funding and supporting this project, but any views expressed are not necessarily endorsed by the QPS. Griffith Criminology Institute
Outline 1 Background 2 What should police do to reduce crime? What do they do? 3 Organisational barriers and innovations 4 Policing Hubs goals & strategies of a pilot trial 5 Preliminary results 6 Outcomes, implications & remaining steps Griffith Criminology Institute
Background: why reinvent policing? A problem with how general duties policing is designed & delivered? A disconnect between practice & public policy goals/research knowledge. The standard policing model is a one-size fits all application of reactive strategies to suppress crime (Weisburd & Eck, 2004) ineffective in: reducing overall levels of crime, and securing public confidence & legitimacy. Is there a better model for contemporary policing? What restricts/promotes its adoption? How is its performance best measured? Focus on organisational design, not policing strategies Griffith Criminology Institute
Standard model of policing Package of frontline policing practices relying on: Random patrol, rapid response to calls for service, reactive investigations, intensive enforcement Supported by geographical allocation of resources, to districts/local commands equity of coverage Resources spread in response to calls for service, not extent/seriousness of problems Specialised services/operations short-term and frequently re- deployed Embeds reactiveness & internal boundaries/barriers Supported by organisational structures & performance management focused on KPI metrics Griffith Criminology Institute
What should police do? What do they do? Research evidence to reduce crime, police should: be less reactive, more proactive use diverse, focused, problem-solving approaches tailor solutions for local problems draw on non-law enforcement resources To maintain confidence & legitimacy, police should work closely with communities What works hot spots, problem-oriented, focused deterrence, directed patrol & third party policing But most police work is still focused on reactive order maintenance and rapid response to calls for service Griffith Criminology Institute
Organisational barriers & innovations What impedes uptake of more effective policing practices? Factors include: Formal bureaucratisation, functional & task differentiation, task complexity, compliance regimes, technology Informal culture, coupling, professionalisation Innovations tend to be seen as one-dimensional, rather than in organisational, environmental & cultural context Innovation needs to be contextual, diffused through the organisation, and measured for success Griffith Criminology Institute
The problem of measuring impact Current measures focus on traditional indicators offence counts, clearance rates, response times, numbers of enforcement actions Record only reaction & not prevention, ignore unreported crimes/non-crime community concerns, prone to manipulation, can distort missions, short- term, don t allow for variable harms from different types of crimes (Sparrow, 2015) How can innovative proactive policing be implemented and better measured? Griffith Criminology Institute
Why policing hubs? QPS Strategic Plan identifies challenges including: managing demand and allocating resources to ensure police services are directed at those who are most in need or greatest risk to public safety Establishing multidisciplinary taskforces that target places, cases and crime types that pose risk to the community; and identifying new crime types Split service model as a potential innovative solution first response resources allocated to: Existing units eg stations calls for service, standard patrols District hubs proactive, case and place focus, rapid response to existing & developing crime problems, able to cross boundaries, develop partnerships Griffith Criminology Institute
The policing hubs trial 2 sites (but focus here on site 1) Different crime profiles/problems different hub models Key evaluation questions: does the hub model have an effect on identified crime problems? does it affect public confidence in police, legitimacy, and fear of crime? does it affect officer satisfaction? is it more or less efficient than traditional models? are there any differences in outcome between the 2 sites? (ie context what explains any impact the hubs have on crime (ie mechanism)? Griffith Criminology Institute
QPS Objective 1: Reduce crime and disorder QPS Objective 2: Build relationships with community 1.1 improve mobility, visibility, agility and connectedness of response by more - collection, analysis and use of intelligence to identify problems - focused resources on preventing/responding to problems - collaborative partnerships to identify problems and solutions 2.1 improve public perceptions of safety by more - officer time in the field - focused resources on preventing/responding to problems 2.2 improve public satisfaction and perceptions of legitimacy by more - community engagement with problems and solutions - collaborative partnerships to identify problems and solutions 1.2 improve detection and prevention of crime by more - collection, analysis and use of intelligence to identify problems - case and place focus in allocating resources - community engagement with problems and solutions 2.3 improve employee engagement by more - officer time in the field - use of technology - focused resources on preventing/responding to problems 1.3 improve efficiency in resourcing by more - officer time in the field - use of technology - focused resources on preventing/responding to problems Griffith Criminology Institute
Crime reduction evaluation measures Strategy 1 increase police visibility, mobility, agility & connectedness Logic (i) improved visibility should improve deterrence of offenders process measures officer time in community vs time in station on administration, timeliness/agility of response to serious crime problems, time taken to clear jobs, integration with district responses Logic (ii) focusing resources on identified crime problem areas should reduce crime process measures officer time in community vs time in station on administration, time spent on targeted responses vs reactive jobs, uptake of intelligence reports Overall outcome measure rates of targeted offences Griffith Criminology Institute
Crime reduction evaluation measures Strategy 2 adopt case and place focus logic (i) focus on problem places should address environmental factors facilitating crime process measures numbers of targeted operations to total hours in community & offences reported, numbers of compliance operations/ operations with third parties logic (ii) focus on problem people should deter re-offending process measures numbers of targeted operations to total hours in community & offences reported, numbers of compliance operations/ operations with third parties Overall outcome measure rates of targeted offences Griffith Criminology Institute
Data Administrative data ITAS officer tasking database QPRIME Calls for service Hub databases and intelligence reports Finance and human resources data Qualitative data Stakeholder survey/interviews Observations, officer interviews/focus groups Preliminary results for today Site 1 only Evaluation Q 1, strategy 1 only Process measures only Griffith Criminology Institute
Percentage of Time Spent on Administrative Activities for Hub/Non-Hub Personnel (2014-15) 100% Non-Hub 75% Percentage 50% Hub 25% 0% 1 2 3 4 5 6 7 8 9 10 11 12 13 14 15 16 17 18 19 20 21 22 23 24 Months
Percentage of Time Spent in Community for Hub and Non-Hub Personnel (2014-15) 100% 75% Hub Percentage 50% Non-Hub 25% 0% 1 2 3 4 5 6 7 8 9 10 11 12 13 14 15 16 17 18 19 20 21 22 23 24 Months
Average Response Time to Critical Code 1 & 2 Incidents for Hub and Non-Hub Personnel (2014-15) 7.50 7.00 Non-Hub 6.50 Response Time (Minutes) 6.00 5.50 5.00 Hub 4.50 4.00 3.50 1 2 3 4 5 6 7 8 9 10 11 12 13 14 15 16 17 18 19 20 21 22 23 24 Months t = 5.84, 95%CI [0.54, 1.11], p < .001
Average Number of Days Taken to Clear Offence for Hub and Non-Hub Personnel (2014-15) 40 35 30 25 Non-Hub Days 20 15 10 Hub 5 0 1 2 3 4 5 6 7 8 9 10 11 12 13 14 15 16 17 18 19 20 21 22 23 24 Months U = 66.00; z = -4.578, p < .001
Time spent on core Hub strategies High Visibility Policing (29%) Targeted Crime (22%) Compliance (9%) Public Places (property offences) (27%) Transport Nodes / Routes (83%) High Risk People (HROs) (41%) Non-Public Places (drug offences) (73%) High Risk Places (3rd party compliance) (59%) High Risk Places (public order) (17%)
Calls for Service for Code 1 and 2 Jobs (2014-15) All District Officers Hub Officers Hour/Day Mon Tue Wed Thu Fri Sat Sun Grand Total Hour/Day 0 1 2 3 4 5 6 7 8 9 10 11 12 13 14 15 16 17 18 19 20 21 22 23 Mon 492 303 401 185 240 127 89 154 122 160 223 233 273 262 232 323 363 407 445 530 533 396 410 291 Tue 192 161 114 127 94 41 46 106 105 144 301 153 205 167 273 213 260 351 305 437 385 264 242 180 Wed 191 101 93 88 99 58 78 85 153 200 168 222 219 215 228 269 287 339 322 316 391 261 277 233 Thu 213 160 105 79 134 59 57 110 146 150 200 157 217 198 209 183 258 233 228 337 371 332 220 235 Fri 192 161 153 66 101 43 47 92 146 196 199 236 166 170 206 219 209 249 294 347 340 300 265 270 Sat 232 195 184 92 93 51 77 106 180 190 182 154 214 220 197 227 288 320 319 414 486 424 554 513 Sun Grand Total 450 314 299 203 132 80 118 124 138 164 285 270 213 214 247 242 283 296 402 464 583 618 547 604 1962 1395 1349 840 893 459 512 777 990 1204 1558 1425 1507 1446 1592 1676 1948 2195 2315 2845 3089 2595 2515 2326 0 41 12 0 3 13 22 47 138 1 36 2 0 0 0 9 29 76 2 40 0 0 0 1 1 19 61 3 2 0 0 0 0 2 2 6 6 0 0 0 2 0 0 0 2 7 6 5 5 4 2 0 1 23 8 4 5 13 2 4 6 3 37 9 6 11 17 12 9 6 3 64 10 8 25 4 9 6 12 8 72 11 15 4 21 12 6 7 17 82 12 13 8 19 5 10 11 5 71 13 21 8 12 5 2 28 11 87 14 9 2 9 8 8 5 14 55 15 20 13 18 3 9 2 5 70 16 19 29 23 19 6 7 11 114 17 25 38 42 14 9 13 16 157 18 24 19 22 16 19 27 22 149 19 62 50 32 24 42 32 25 267 20 34 34 37 40 53 44 36 278 21 41 1 4 26 43 49 87 251 22 27 1 0 9 33 54 37 161 23 29 1 0 16 28 42 51 167 Grand Total 7194 4866 4893 4591 4667 5912 7290 U = 271.00 z = .16, p = .876 39413 Grand Total 482 268 278 229 303 379 449 2388
Discussion, implications & remaining steps Preliminary results suggest that for site 1, Hub officers: are able to spend less time on administration, more time in the community are quicker to resolve jobs are quicker/more agile in response to serious crimes have increased amount of time spent on targeted operations, focused on case & place Qualitative data suggests: high levels of hub officer satisfaction - this is the kind of thing I got into policing to do better understanding of key targeted crime reduction strategies but some communication/perception/cultural problems between units Griffith Criminology Institute
Implications for police organisations: Split service model may be a way of shifting officers from the standard policing model to more proactive approaches Requires resourcing & adoption of technology Model needs to be adapted to environmental context of the site New ways of measurement are important, both to capture activity & measure outcome Culture can be a barrier to integration Griffith Criminology Institute
Still to answer Is increased time in community actually spent in proactive activities? Is there a greater reliance on intelligence to direct targeted activities? Are partnerships being leveraged to their full extent? Has there been an impact on crime? Have there been efficiency/satisfaction improvements? Are there differences between the 2 sites? Griffith Criminology Institute
Thank you j.ransley@griffith.edu.au Griffith Criminology Institute

