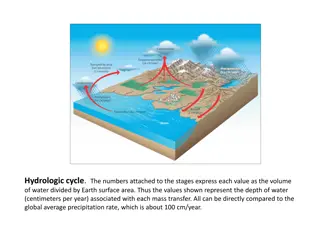
Evaluating Accuracy of Quantitative Precipitation Estimates in Hydrologic Modeling
This study presents a method to assess the accuracy of quantitative precipitation estimates within a hydrologic modeling framework. The approach outlined by Gourley and Vieux (2005) offers insights for evaluating the reliability of precipitation data, crucial for effective water resource management and flood forecasting.

Download Presentation

Please find below an Image/Link to download the presentation.
The content on the website is provided AS IS for your information and personal use only. It may not be sold, licensed, or shared on other websites without obtaining consent from the author.If you encounter any issues during the download, it is possible that the publisher has removed the file from their server.
You are allowed to download the files provided on this website for personal or commercial use, subject to the condition that they are used lawfully. All files are the property of their respective owners.
The content on the website is provided AS IS for your information and personal use only. It may not be sold, licensed, or shared on other websites without obtaining consent from the author.
E N D
Presentation Transcript
A Method for Evaluating the Accuracy of Quantitative Precipitation Estimates from a Hydrologic Modeling Perspective Gourley, Jonathan J., Baxter E. Vieux, 2005: A Method for Evaluating the Accuracy of Quantitative Precipitation Estimates from a Hydrologic Modeling Perspective. J. Hydrometeor, 6, 115 133. Speaker: Yi-Jui ,Su Advisor: Professor Ming-Jen,Yang Date : 2013/05/21
Outline Introduction Methodology QPE data Ranked probability score (RPS) Vlfo model Work flow Results and discussion Conclusions References
introduction The ensemble approach can provide a setting user-specified ranges and be more objective it s not a designed to favor a model input The unique methodology has been developed to evaluate the relative skill of hydrologic simulations using different QPE inputs Analyze the accuracy of the multisensor to QPE on hydrologic simulation
introduction Background Blue River basin, Oklahoma Hourly discharge observations from USGS KTLX (WSR-88D) (site number 07332500)
Methodology QPE data GAG (gauge only) Oklahoma Meso-network(Mesonet) 1km x 1km common grid using a Barnes scheme (Barnes 1964) RAD (radar only) Data from KTLX Empirical formula : MS (multisensor) By QPESUMS (Gourley et al.2001) Complex from radar, numerical models and infrared satellite data (Woodley et al. 1975) Gauge-adjustment for RAD and MS 1
Methodology Gauge-adjustment Mean field bias adjustments (-G) (Wilson and Brandes 1979) Local bias adjustment (-LG) (Seo and Breidenbach 2002) where ( t is the threshold for multiplicative sample bias )
Methodology Ranked probability score (RPS) For the ensemble results, we use the Gaussian kernel density estimation to get the probability density function (pdf). (Silverman 1986) , where To assess the ensemble skill, we use the ranked probability score (RPS; Wilks 1995) J is the event number
Methodology Ranked probability score (RPS) Example: If the threshold table of the pdfs as Pdfs table 0~0.5 mm 0.6mm ~4 mm >4mm Case1 0 1 0 Caer2 0 0 1 Forecast 0.4 0.5 0.1 the cumulative distribution function (cdf) Pdfs table 0~0.5 mm 0.6mm ~4 mm >4mm Case1 0 1 1 Caer2 0 0 1 Forecast 0.4 0.9 1 ???1= (0.4 0)2+(0.9 1)2+(1 1)2= 0.17 ???2= (0.4 0)2+(0.9 0)2+(1 1)2= 0.97
Methodology Vlfo model (Vieux and Vieux 2002) By the 1D conservation of mass and momentum equations : i :Soil infiltration rate r :Rainfall rate S0: bed slope Sf: friction slope For the kinematic wave, the order of slope >> other forcing: , and we assume that it s subcritical The Mannig s equation in SI units: As w>>h ; R is the hydraulic radius Substituting all into (B1), we got the governing equation used in the Vlfo model:
Methodology Vlfo model (Vieux and Vieux 2002) Overland flow Channelized flow The soil infiltration rate ( i ) use the Green-Ampt equation , and To compute the cumulative infiltration (I), we should know K, and
Methodology The variable inputted n : Manning coefficient r : rainfall rate A: Cross-sectional area Q : channel flow rate S0: bed slope K: saturated hydraulic conductivity : soil suction at wetting front (as 1/K ,Chow et al.1998) : initial fractional water content
Work flow STATSGO DEM Initial soil properties like K, and n S0: bed slope Flow property Parameter maps(i=0~4) QPE The scalars for K K and n n : : from 20% to 100% (+20% *i) GAG RAD MS -G -LG Vlfo model 137.5 % 137.5 % 80% K 25% 62.5% 100% 175% n 25% 62.5% 100% 175% 20% 40% 60% 100% 7 rainfall inputs 125 ensemble
The time of maximum discharge Compare to the observation Work flow Runoff coefficient Bias Mean absolute error Mean value Root-mean-square error The maximum peak The total discharge volume Probability distribution function (pdf) Cumulative distribution function (cdf) Ranked probability score (RPS)
Results & discussion Three case as follow We just discuss the first case and its result
Results & discussion Case1: 23 Oct 2002 Total precipitation -G maintain the pattern -LG smooth the spatial details The KTLX radar was miscalibration and overestimate. (Gourley et al.2003)
Case 1 MS MS RAD Time Peak RAD-G MS Discharge Volume
Case 1 In the PDF pattern, Bimodal shape caused by the parameter maps set in the Vlfo model. The members of set as 100% have higher peak and volume mode, but lower time density the nonlinear effect for the soil infiltration rate The infiltration as ponding
Case 1 Time Peak overestimate GAG RAD RAD-G RAD-LG MS MS-G MS-LG GAG RAD RAD-G RAD-LG MS MS-G MS-LG Volume overestimate GAG RAD RAD-G RAD-LG MS MS-G MS-LG
Case 1 RAD-G have the best performance in Time The MS ,MS-G are bad predictions in Time, but good in Peak and Volume Having more relationship with the gauge data(GAG,RAD- LG,MS-LG) will tend to have better performance in time than in peak and volume -LG were bad in Peak and Volume
Summary and conclusions Setting the range of parametric uncertainty and the algorithms of objectively evaluating QPE provide more objective estimation. is a important parameter for infiltration, we need the initial data and the spatial variability. Ranked probability score (RPS) can show the capability for ensemble forecast.
Summary and conclusions Rain gauge data can t provide a accurate depiction of the spatial variability of the rainfall field . Satellite data may play an important role in QPE where ground-based radar cannot obtain a representative, low-level sample.
Summary and conclusions Mean field bias adjustment(-G) have better result than local bias adjustment (-LG) in the hydrologic simulation. -LG emphasis on individual rain gauge measurements, and the spatial details in original rainfall field are smoothed. -G -LG
References Gourley, Jonathan J., Baxter E. Vieux, 2005: A Method for Evaluating the Accuracy of Quantitative Precipitation Estimates from a Hydrologic Modeling Perspective. J. Hydrometeor, 6, 115 133. Wilks, D. S., 1995: Statistical Methods in the Atmospheric Sciences: An Introduction. Academic Press, 467 pp. Seo, D.-J., and J. P. Breidenbach, 2002: Real-time correction of spatially nonuniform bias in radar rainfall data using rain gauge measurements. J. Hydrometeor., 3, 93 111. Wilson, James W., Edward A. Brandes, 1979: Radar Measurement of Rainfall A Summary. Bull. Amer. Meteor. Soc., 60, 1048 1058. Oklahoma Water Survey : http://oklahomawatersurvey.org/?p=387 The KTLX radar : http://weather.gladstonefamily.net/site/KTLX