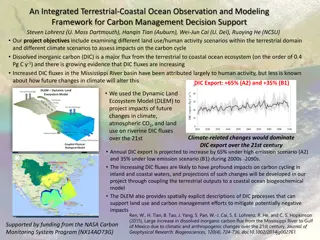
Evaluating Countries' Fair Share in Carbon Cuts & Emissions Per Capita
Targets for greenhouse gas emissions, fair sharing of GHG reductions, and varying perspectives on emissions per capita are explored in the context of international climate action discussions. The complexities of determining fair burden-sharing among nations and the challenges posed by disparities in emissions levels across different countries are highlighted.

Download Presentation

Please find below an Image/Link to download the presentation.
The content on the website is provided AS IS for your information and personal use only. It may not be sold, licensed, or shared on other websites without obtaining consent from the author. If you encounter any issues during the download, it is possible that the publisher has removed the file from their server.
You are allowed to download the files provided on this website for personal or commercial use, subject to the condition that they are used lawfully. All files are the property of their respective owners.
The content on the website is provided AS IS for your information and personal use only. It may not be sold, licensed, or shared on other websites without obtaining consent from the author.
E N D
Presentation Transcript
Evaluating Which Countries Evaluating Which Countries Do their Fair Share in Pledged Carbon Cuts Do their Fair Share in Pledged Carbon Cuts Prof. Jeffrey Frankel Prof. Jeffrey Frankel Harvard University Harvard University T20 for the Indonesia Presidency of G20 in 2022, Webinar on Managing Elevated Risks of Climate Transition, June 2, 2022
Targets for Greenhouse Gas emissions Paris Agreement in 2015: countries set Nationally Defined Contributions. The Glasgow Climate Pact in Nov. 2021: all countries should strengthen targets in their NDCs in 2022. President Biden in 2021 announced a US GHG target for 2030, slightly more ambitious than in Paris: 50 - 52 % below 2005 levels. So did Canada: 40 - 45 % below 2005 levels. But, then, the US & Canada started from high emissions. 2
Fair share of the reductions in GHG emissions? How can we tell what is a fair share of the burden for each country, given its circumstances? Climate Action Tracker (June 2022) collects various attempts at scorecards. It rates most countries as Insufficient or highly insufficient. Perceptions of fairness vary wildly. 3
CO2 emissions/capita vary widely across countries. In 2020 The average American emitted 8 times as much GHGs as an average Indian: 13.7 vs. 1.7 mt/cap . The average Saudi emitted 8 times as much as an average Indonesian: 17.0 vs. 2.1 mt/cap. 4
Different vantage points From the vantage of India or Indonesia, a fair allocation might be equal emissions/capita all around. Americans, for their part, think it would be unfair to make US firms pay a very high economic cost to reduce emissions, especially if energy-intensive industries simply relocated to developing countries that had not constrained their own emissions. 5
Each side has a point. Unreasonable to ask poor countries to cut the same %-age as the rich. This would deny them the opportunity for economic growth that rich countries have already enjoyed, while the rich created the problem. Unrealistic to expect rich countries to agree to equal emissions/cap, at least, anytime soon. That would be equivalent to transferring truly massive slices of GDP. 6
One can quantify fair & reasonable targets for each. Three principles: Cost: It is not realistic to expect any one country to agree to cuts that would result in disproportionately large economic costs for it, measured relative to what their emissions would otherwise have been, the Business as Usual path (BAU). Progressivity: Rich countries should accept bigger cuts than poor. Short-term targets for poor countries could be generous enough, & close enough to their BAUs, that they would financially come out ahead at first: they could sell emission permits to high-income countries. Climate Finance. Latecomer Catchup: It is fair to expect countries that have increased their emissions to bring them back down gradually toward past levels, but not practical for them to reverse fully & instantly in the first budget periods. 7
Targets agreed in pastUNFCC COPs tendstatistically to obey a formula that quantifies the 3 principles. Progressivity -- Richer countries agreed to steeper cuts than others: At Kyoto in 1997, every 10 % rise in income/cap corresponded to an agreed GHG reduction of another 1.4 % relative to BAU. At Lima in 2014 (pre-Paris), every 10% rise in income corresponded to another GHG cut of 1.7 % relative to BAU. 8
COP targets also showed latecomercatch-up factor pulling each country back toward what its emissions were in 2005. Extend the formula through the remainder of the century, with gradually decreasing weight on the past and gradually increasing weight on equal per capita targets. Model estimates show country losses < 1 % of GDP in PDV. References: Valentina Bosetti & J. Frankel, 2021, How to Set Greenhouse Gas Emission Targets for All Countries, Chapter 6 in Combatting Climate Change, B. Weder di Mauro, ed. (CEPR Press), pp. 43-48. -------,- 2014, Sustainable Cooperation in Global Climate Policy: Specific Formulas and Emission Targets, Climate Change Economics, vol.5, no.3, Aug. --------- , 2012, Politically Feasible Emission Target Formulas to Attain 460 ppm CO2 Concentrations," Rev. of Environmental Econ. & Policy (Oxford Univ. Press) 6, no.1, pp. 86-109. J. Frankel, 2009, "An Elaborated Proposal for Global Climate Policy Architecture: Specific Formulas and Emission Targets for All Countries in All Decades, Chapter 2 in Post-Kyoto International Climate Policy, J. Aldy & R. Stavins, eds., pp. 31-87 (Cambridge Univ. Press). 9
Progressivity & LCF are both statistically significant in explaining 2020 cuts targeted in 2014. Table 1: Regression estimates to explain 2020 goals set in 2014 EXPLANATORY VARIABLES: (1) (2) Ln (GDP per capita2010) = PROGRESSIVITY FACTOR ln (Emissions2005) - ln (BAU2020) = LATECOMER CATCH-UP FACTOR Constant -0.15*** -0.14*** (0.04) 1.32*** 1.29*** (0.36) (0.025) 0.52*** (0.08) (0.23) 30 observations R2 *** p<0.01 0.35 0.74 10
Countries targets set in 2014 for 2020 GHG cuts (relative to a baseline = average of its actual 2005 emissions & 2020 BAU) rise with income/cap. 11
Models We use an economic/climate model to estimate BAU and to translate pledges into common terms of emission tons: A.Hof, M. den Elzen, & M. Roelfsema, 2013. The Effect of Updated Pledges and Business-as-Usual Projections, and New Agreed Rules on Expected Global Greenhouse Gas Emissions in 2020. Environmental Science & Policy 33, Nov., pp. 308 19. And we use the WITCH model to project effects of targets: V. Bosetti, E. De Cian, A. Sgobbi, & M. Tavoni, 2009. The 2008 WITCH Model: New Model Features and Baseline . FEEM Working Paper N. 85. 12
The bad news: most failed by 2020 to achieve these promised targets. Stronger country commitments to specific targets are needed. A good place to start: (i) report publicly which countries have met the emission targets that they set for 2020; and (ii) evaluate whether current pledges for 2030 show individual countries as doing their fair share when judged by criteria like mine. Needed as well: is an international agreement that allows countries that have made pledges, and are abiding by them, to impose a Carbon Border Adjustment Tariff against relevant imports from countries that have not. 13
The bad news: most failed to reach their promised targets by 2020. We need stronger country commitments to numerical targets. A good place to start: (i) report publicly which countries have met the targets that they set for 2020; (ii) evaluate whether current pledges for 2030 show individual countries as doing their fair share when judged by criteria like mine. Also needed: an international agreement allowing countries that abide by pledges to impose Carbon Border Adjustment Tariffs against relevant imports from countries that have not made pledges or are not abiding by them. 14
Appendix Countries GHG emissions targets set in 2014 for 2020 minus the formula s evaluation of their fair shares. But remember: most countries failed to achieve these targets for 2020. 15