Evaluating Financial Statements: Key Ratios and Analysis
Join Boz Bostrom, CPA and Professor, in exploring financial statement evaluation, key ratios, investor and creditor perspectives, and the importance of different financial ratio categories. Enhance your knowledge on how to assess a company's financial health effectively.

Download Presentation

Please find below an Image/Link to download the presentation.
The content on the website is provided AS IS for your information and personal use only. It may not be sold, licensed, or shared on other websites without obtaining consent from the author. If you encounter any issues during the download, it is possible that the publisher has removed the file from their server.
You are allowed to download the files provided on this website for personal or commercial use, subject to the condition that they are used lawfully. All files are the property of their respective owners.
The content on the website is provided AS IS for your information and personal use only. It may not be sold, licensed, or shared on other websites without obtaining consent from the author.
E N D
Presentation Transcript
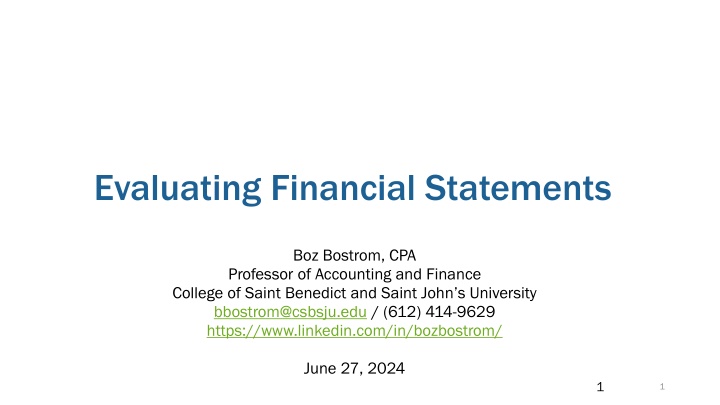
Evaluating Financial Statements Boz Bostrom, CPA Professor of Accounting and Finance College of Saint Benedict and Saint John s University bbostrom@csbsju.edu / (612) 414-9629 https://www.linkedin.com/in/bozbostrom/ June 27, 2024 1 1
Logistics Polling questions throughout the meeting Required for CPE If you have issues answering the polling questions, please chat across your answer 2.0 CPE Hours (Accounting Technical) Partial credit available minimum of 1.0 hour Questions (and tips) are very welcome, submit through chat at any time Course evaluation and CPE Certificate will be emailed within a day 2
Learning objectives Discuss key financial ratios to use in financial statement analysis Identify how investors and creditors evaluate financial performance 3
Financial Ratio Categories (according to the Corporate Financial Institute) Liquidity ratios Leverage ratios Efficiency ratios Profitability ratios Market value ratios We will also cover Growth ratios 6
Users of Financial Statements Equity Investors Determine whether to buy/sell/hold stock Highly used Growth, profitability, and market ratios Less Common Liquidity, leverage, and efficiency 7
Users of Financial Statements Lenders Determine whether to extend loans or purchase bonds Determine interest rates Highly used Liquidity and Leverage ratios Less Common Efficiency, Profitability, Market value, and growth ratios 8
Users of Financial Statements Managers Benchmarking and areas for improvement Forecasting Highly used Efficiency, profitability, and growth ratios Less Common Liquidity, leverage, and market value ratio (except when considering how they will be used by others) 9
Users of Financial Statements Auditors Evaluating areas of risk Highly used Efficiency Increases in days receivables or inventories may require increased reserves Increases in days payables may indicate financial troubles Growth and profitability ratios used in ASC 350 (Goodwill and Intangible) Valuations Less Common Profitability, Market, liquidity, and leverage ratios 10
Users of Financial Statements Tax Advisors Developing planning ideas and structures / projections often needed Tax valuations and transfer pricing Highly used Profitability and growth ratios Leverage ratios (adding leverage) Efficiency ratios (transfer pricing) Less Common Market value and liquidity ratios 11
Users of Financial Statements Others Non-profit donors Should I make a donation? Citizens Is this government using its funds wisely? Customers Is this company going to be a potential supplier for the long-term? Vendors Can the company repay me? Employees Should I work for this company? Will it sustain? Competitors Where is this company beating (or lacking) us? 12
What do companies report? Let s look at earnings releases for a couple public companies Best Buy 3M Medtronic How about some others? 13
Using Ratios Don t look at them in isolation Compare them to two primary things: Company s performance over time Peers performance over time 14
When comparing to company performance over time Some ratios will naturally change over time Can t grow at a higher rate forever Tough to be profitable if investing more heavily in R&D and marketing Exclude one-time items: Impairments and Restructuring Be careful that these one-time items don t simply recur every year Recurring non-recurring items Improving in one area could cause issues in another area e.g., Driving sales growth by expanding inventory selection, relaxing payment terms or credit standards 15
When comparing to peers Important to identify peers and aspirants Try to identify at least several peers Can look at full range, but also focus on medians and averages Be aware of limitations in your company s strategy which will make it impossible to measure up to peers at times Target will not have same turnover ratios as Costco or Wal-Mart Some banks will take more aggressive approaches or value customer service (higher margins) over maximizing number of loans processed 16
Other Ratios (Growth Ratios) Percent change in revenues Percent change in revenues Current Year revenues - Prior Year revenues / Prior year revenues Percent change in EPS Percent change in EPS Current Year EPS - Prior Year EPS / Prior year EPS 18
Understanding Terms Important to understand what is meant by revenue growth Total organic same store Revenue growth is a function of both change in quantity sold and selling price Optimally a company should be at least slowly increasing both If a company is growing earnings, why do we care if it is growing revenues? For non-profits, revenues can mean donations In government, revenues are often primarily from taxes, which are policy decisions In Higher-Ed, revenues can be both from enrollment and donations (endowment draws) A bad year of enrollment will impact 4 years of financial statements! 19
Companies we will look at Minnesota-headquartered companies 3M Diversified manufacturer. Sells to retailers Ecolab Water treatment and cleaning products. Sells to businesses Hormel Branded food company. Sells to grocery stores Target Retailer. Sells to consumers United Health Managed healthcare and insurance. Sells to businesses and individuals Xcel Energy Utility company. Sells to businesses and individuals 20
Companies we will look at Notable companies Amazon Online sales, cloud computing, digital streaming, and AI. Sells to individuals and businesses Apple Electronics, software, and online services. Sells to individuals and businesses Boeing Aircraft and aerospace manufacturer. Sells to airlines and the government Johnson & Johnson World s largest healthcare products company. Sells to individuals and businesses 21
Revenue Growth % Change in Revenues 16.8% 14.6% 11.8% 8.0% 6.5% -1.6% -2.8% -2.8% -4.5% -7.2% Median was 2.4% Company 3M Amazon Apple J&J Ecolab Boeing Hormel Target UnitedHealth Xcel Energy Company Boeing UnitedHealth Amazon Ecolab J&J Target Hormel Apple 3M Xcel Energy 22
EPS Growth Equity investors in large public companies generally expect returns of about 8-12% Dividends and stock price appreciation Private equity or venture capital investors would likely expect 15-20% or more How does a company grow EPS? More net income Lower number of shares (repurchases) Why is it a problem if a company that doesn t pay a dividend is only growing EPS by 5% or so? Assuming PE multiples are constant, that implies only 5% stock growth 23
EPS Growth % Change in EPS 102.8% 49.0% 25.8% 12.3% 1.1% 0.1% -20.9% -55.8% -223.7% -1205.3% Median was 0.6% Company J&J Target Ecolab UnitedHealth Xcel Energy Apple Hormel Boeing 3M Amazon Company 3M Amazon Apple J&J Ecolab Boeing Hormel Target UnitedHealth Xcel Energy 24
Oddities and Unexpected items JNJ had a large gain on sale Boeing has had losses due to issues with its planes 737 Max planes have been grounded twice 3M had a litigation charge Amazon had income (loss) from equity investments 25
How do companies handle these issues? Report adjusted earnings From 3M s 2023 press release: So, instead of EPS being down 223.7%, it is only down 6.5% 26
Is high growth always a good thing? Percent change in revenue Higher is normally better, but Costs can get out of control Percent change in EPS (GAAP and adjusted) Higher is normally better, but Cost-cutting which focused on the short-term 27
Profitability Ratios Gross margin ratio Gross margin ratio compares the gross profit of a company to its net sales to show how much profit a company makes after paying its cost of goods sold: Gross margin ratio = Gross profit / Net sales Operating margin ratio Operating margin ratio, sometimes known as the return on sales ratio, compares the operating income of a company to its net sales to determine operating efficiency: Operating margin ratio = Operating income / Net sales Some users will compute an EBITDA margin ratio, which is EBITDA / Net sales Return on assets ratio Return on assets ratio measures how efficiently a company is using its assets to generate profit: Return on assets ratio = Net income / Total assets Return on equity ratio Return on equity ratio measures how efficiently a company is using its equity to generate profit: Return on equity ratio = Net income / Shareholder s equity 29
Expectations What types of companies will likely have high gross margins? Services providers Those with valuable patents 30
Gross Margin Ratio Gross margin ratio 68.8% 59.3% 47.0% 44.1% 43.5% 40.2% 27.6% 20.2% 16.5% 9.9% Median was 41.9% Company 3M Amazon Apple J&J Ecolab Boeing Hormel Target UnitedHealth Xcel Energy Company J&J Xcel Energy Amazon Apple 3M Ecolab Target UnitedHealth Hormel Boeing 31
Oddities and Unexpected items Xcel Energy doesn t clearly specify Gross Margin Amazon doesn t seem very profitable, but Amazon Web Services presumably has a VERY high gross margin 32
Operating Margin Ratio Median was 8.8% Company Apple J&J Xcel Energy Ecolab Hormel UnitedHealth Amazon Target Boeing 3M OI % of Sales 29.8% 25.5% 17.5% 13.0% 8.9% 8.7% 6.4% 5.3% -1.0% -27.9% Company 3M Amazon Apple J&J Ecolab Boeing Hormel Target UnitedHealth Xcel Energy 33
Comparing GM and OI Ratios. The difference is SG&A Expenses (includes R&D) SG&A Exp % of Sales 71.4% 43.3% 41.8% 40.6% 27.2% 22.3% 14.3% 11.5% 10.9% 7.7% Company 3M J&J Xcel Energy Amazon Ecolab Target Apple UnitedHealth Boeing Hormel 34
Oddities and Unexpected items 3M has a large litigation charge OI margins are over 20% excluding this charge 35
EBITDA Margin Ratio Median was 12.9% Company Apple J&J Xcel Energy Ecolab Hormel UnitedHealth Amazon Target Boeing 3M OI % of Sales 29.8% 25.5% 17.5% 13.0% 8.9% 8.7% 6.4% 5.3% -1.0% -27.9% Company 3M Amazon Apple J&J Ecolab Boeing Hormel Target UnitedHealth Xcel Energy 36
EBITDA margins What types of companies have EBITDA margins much larger than Operating margins? Why do many investors prefer EBITDA over operating income? Depreciation/Amortization are non-cash items As capital expenditures are a cash flow item, in theory Free Cash Flow margins may be best 37
EBITDA > OI 17.4% 8.8% 8.5% 6.1% 6.0% 3.0% 2.6% 2.4% 2.1% 1.1% Comparing EBITDA and OI Margins Company Xcel Energy J&J Amazon 3M Ecolab Apple Target Boeing Hormel UnitedHealth Will EBITDA margins always be higher? 38
Is high profitability always a good thing? Gross margin as a % of Net Revenues Higher is normally better, but Competitors will eventually catch-up so an eventual decline should be expected Operating Income and EBITDA as a % of Net Revenues (GAAP and adjusted) Higher is normally better, but Could turnover be increased? 39
Liquidity Ratios Current ratio Current ratio measures a company s ability to pay off short-term liabilities with current assets: Current ratio = Current assets / Current liabilities Acid Acid- -test ratio test ratio measures a company s ability to pay off short-term liabilities with quick assets: Acid-test ratio = Current assets Inventories / Current liabilities Cash ratio Cash ratio measures a company s ability to pay off short-term liabilities with cash and cash equivalents: Cash ratio = Cash and Cash equivalents / Current Liabilities Operating cash flow ratio Operating cash flow ratio is a measure of the number of times a company can pay off current liabilities with the cash generated in a given period: Operating cash flow ratio = Operating cash flow / Current liabilities 41
Considerations The more stable a company is, the less liquidity it needs Start-up companies often secure financing to ensure liquidity 42
Current Ratio Median was 1.1 Company Hormel Ecolab J&J Boeing 3M Amazon Apple Target UnitedHealth Xcel Energy Current ratio Company 3M Amazon Apple J&J Ecolab Boeing Hormel Target UnitedHealth Xcel Energy 1.4 1.3 1.2 1.1 1.1 1.0 1.0 0.9 0.8 0.7 43
A current ratio of at least 1.0 Many people believe a high current ratio is a good thing, or that a current ratio must be at least 1.0 At first glance, they are correct. If the ratio is less than 1.0, the company s won t be able to payoff its current liabilities with its current assets What will it have to do? Borrow Anything else? 44
The Walmart Case As of Jan 31, 2023, Walmart had: Current assets of $76 billion Current liabilities of $92 billion Did Walmart go bankrupt? No, of course not What did it do? Borrow? Sell Assets? Issue Stock? No, it did not! In fact, debt decreased What else? Used some of the $35 billion of cash it generated from Operating Activities 45
Is high liquidity always a good thing? Current Ratio Higher is normally conservative, but Conservative strategies can lower returns Apple has about $160 billion of cash and investments on its balance sheet It earns $3 billion - $4 billion each year on these assets About 2% Apple returns about $100 billion per year to shareholders through dividends and stock buybacks. Maybe it should do more! 46
Leverage Ratios Debt ratio Debt ratio measures the relative amount of a company s assets that are provided from debt: Debt ratio = Total liabilities / Total assets Debt to equity ratio Debt to equity ratio calculates the weight of total debt and financial liabilities against shareholders equity: Debt to equity ratio = Total liabilities / Shareholder s equity Interest coverage ratio Interest coverage ratio shows how easily a company can pay its interest expenses: Interest coverage ratio = Operating income / Interest expenses Debt service coverage ratio Debt service coverage ratio reveals how easily a company can pay its debt obligations: Debt service coverage ratio = Operating income / Total debt service Leverage ratio Leverage ratio* compares a company s debt level to its operating cash flows Debt / EBITDA *Not a ratio listed by the Corporate Finance Institute 48
Common debt covenants Generally compare debt or an income item with an expense items Debt to EBITDA (leverage ratio) Operating Income to Interest Expense (interest coverage ratio) 49
Possible consequences of violating a debt covenant The borrower may be required to meet additional collateral requirements The borrower could face a reduction in credit availability The lender could subject the borrower to a higher interest rate The lender could demand renegotiated loan terms less favorable to the borrower The borrower could be forced to implement job cuts, including managerial turnover The lender could liquidate the borrower s assets The lender could seize the borrower s business and auction it to the highest bidder https://www.sofi.com/learn/content/what-is-a-debt-covenant/ 50


")