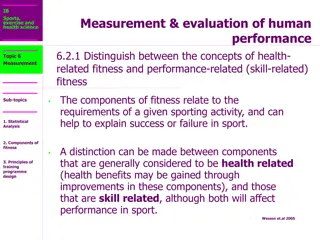
Evaluating Significance of Individual Change in Health-related Quality of Life
This study examines the statistical significance of health-related quality of life changes in individual patients. The research focuses on physical functioning and emotional well-being of 54 patients with various health conditions at UCLA's Center for East-West Medicine. Significant improvements were observed in most SF-36 scales, with effect sizes indicating medium to large changes. The findings provide valuable insights into evaluating and understanding individual health outcomes.

Download Presentation

Please find below an Image/Link to download the presentation.
The content on the website is provided AS IS for your information and personal use only. It may not be sold, licensed, or shared on other websites without obtaining consent from the author.If you encounter any issues during the download, it is possible that the publisher has removed the file from their server.
You are allowed to download the files provided on this website for personal or commercial use, subject to the condition that they are used lawfully. All files are the property of their respective owners.
The content on the website is provided AS IS for your information and personal use only. It may not be sold, licensed, or shared on other websites without obtaining consent from the author.
E N D
Presentation Transcript
Evaluating the Significance of Individual Change May 14, 2018 (3:00 4:00 PDT) RCMAR Methods Seminar Series Hays, R. D., Brodsky, M., Johnston, M. F., Spritzer, K. L., & Hui, K. (2005). Evaluating the statistical significance of health-related quality of life change in individual patients. Evaluation and the Health Professions, 28, 160-171. Ron D.Hays, Ph.D. drhays@ucla.edu
Physical Functioning and Emotional Well-Being at Baseline for 54 Patients at UCLA-Center for East West Medicine East-West AIDS Symptomatic Asymptomatic MS ESRD Mental Physical Diabetes Depression Prostate disease GERD Epilepsy General Pop 0 10 20 30 40 50 60 MS = multiple sclerosis; ESRD = end-stage renal disease; GERD = gastroesophageal reflux disease. 2 2
Physical Functioning and Emotional Well-Being at Baseline for 54 Patients at UCLA-Center for East West Medicine East-West AIDS Symptomatic Asymptomatic MS Mental Physical ESRD Diabetes Depression Prostate disease GERD Epilepsy General Pop 0 10 20 30 40 50 60 MS = multiple sclerosis; ESRD = end-stage renal disease; GERD = gastroesophageal reflux disease. 3 3
Significant Improvement in all but 1 of SF-36 Scales (Change is in T-score metric) Change t-test prob. PF-10 RP-4 BP-2 GH-5 EN-4 SF-2 RE-3 EWB-5 PCS MCS 1.7 4.1 3.6 2.4 5.1 4.7 1.5 4.3 2.8 3.9 2.38 3.81 2.59 2.86 4.33 3.51 0.96 3.20 3.23 2.82 .0208 .0004 .0125 .0061 .0001 .0009 .3400 .0023 .0021 .0067 4
Effect Size (Follow-up Baseline)/ SDbaseline Cohen s Rule of Thumb: ES = 0.20 Small ES = 0.50 Medium ES = 0.80 Large 5
Effect Sizes for Changes in SF-36 Scores Effect Size 50 0.53 0.36 0.13 0.35 0.35 0.21 0.11 0.41 0.24 0.30 45 40 35 30 25 Baseline 20 Followup 15 10 5 0 PFI Role-P Pain Gen H Energy Social Role-E EWB PCS MCS PFI = Physical Functioning; Role-P = Role-Physical; Pain = Bodily Pain; Gen H=General Health; Energy = Energy/Fatigue; Social = Social Functioning; Role-E = Role-Emotional; EWB = Emotional Well-being; PCS = Physical Component Summary; MCS =Mental Component Summary. 0.11 0.13 0.21 0.24 0.30 0.35 0.35 0.36 0.41 0.53 6
Defining a Responder: Reliable Change Index (RCI) X X 2 1 ( 2 ( ) ) SEM = 1 SEM SD r bl xx Note: SDbl= standard deviation at baseline rxx = reliability 7
Significant Change X X 2 1 > = 1.96 ( 2 ( ) ) 1 ( ) SD r xx 8
Amount of Change in Observed Score Needed To be Statistically Significant ( 2 (SD) ) r - (1 (1.96) ) xx = 2.77 * SDbl * SQR (1- rxx) Coefficient of reproducibility Note: SDbl= standard deviation at baseline and rxx = reliability 9
How Reliability Relates to Amount of Individual Change Needed Reliability SQR (1- rxx) Change Needed 0.70 0.55 1.5 SD 0.80 0.44 1.2 SD 0.90 0.32 0.9 SD 0.95 0.22 0.6 SD 0.97 0.17 0.5 SD 2.77 * SQR (1- rxx) * SDbl 10
Amount of Change Needed for Significant Individual Change Effect Size 1.33 1.07 0.67 0.72 1.01 1.13 0.71 1.26 0.62 0.73 PFI = Physical Functioning; Role-P = Role-Physical; Pain = Bodily Pain; Gen H=General Health; Energy = Energy/Fatigue; Social = Social Functioning; Role-E = Role-Emotional; EWB = Emotional Well-being; PCS = Physical Component Summary; MCS =Mental Component Summary. 11
7-31% Improve Significantly % Improving % Declining Difference PF-10 RP-4 BP-2 GH-5 EN-4 SF-2 RE-3 EWB-5 PCS MCS 13% 31% 22% 7% 9% 17% 15% 19% 24% 22% 2% 2% 7% 0% 2% 4% 15% 4% 7% 11% + 11% + 29% + 15% + 7% + 7% + 13% 0% + 15% + 17% + 11% 12
Observational Study of ~1800 Chiropractic Patients in Treatment for Chronic Low Back or Neck Pain Reliability and Baseline Means for PROMIS-29 v2.0 Scales Scale Reliability 0.86 0.88 0.93 0.85 0.93 0.93 0.90 0.97 Baseline Mean 46 44 47 48 52 50 46 48 Physical functioning Pain Fatigue Sleep Disturbance Social Health Emotional distress PROMIS-29 Physical PROMIS-29 Mental
Baseline and Endpoint (3 months later) Means and Within Group t-tests Scale Baseline Mean 46 44 47 48 52 50 46 48 Endpoint Mean 47 46 48 50 53 50 47 50 t-test of change 4.15 9.48 7.11 8.47 7.61 0.04 5.80 9.06 Effect Size .07 .19 .15 .18 .15 .01 .10 .16 Physical functioning Pain Fatigue Sleep Disturbance Social Health Emotional distress PROMIS-29 Physical PROMIS-29 Mental Note: Net benefit from manipulation at 3 months in UK BEAM (back pain exercise and manipulation) randomized trial was about 3 points on the SF-36 PCS and MCS (BMJ, 2004).
Significance of Individual Change in PROMIS-29 v2.0 Scales from Baseline to Endpoint (3 months later) Scale Effect Size .07 .19 .15 .18 .15 .01 .10 .16 Got worse 9% 9% 13% 6% 12% 16% 9% 18% Same Got better 13% 17% 23% 14% 21% 16% 14% 30% Physical functioning Pain Fatigue Sleep Disturbance Social Health Emotional distress PROMIS-29 Physical PROMIS-29 Mental Note: Change (Got worse or Got better) was determined by coefficient of reproducibility = 2.77 * standard error of measurement. Responders were those in the Got Better subgroup. 78% 74% 64% 80% 67% 68% 76% 52%
Item Responses and Trait Levels Person 1 Person 2 Person 3 Trait Continuum Item 1 Item 2 Item 3 16
The PROMIS Metric T Score Mean = 50 SD = 10 Referenced to US General Pop. T = 50 + (z * 10) www.healthmeasures.net 18
Normal Distribution Within 1 SD = 68.2%, 2 SDs =95.4%; 3 SDs = 99.6%
Reliability Target for Use of Measures with Individuals Reliability ranges from 0-1 0.90 or above is goal SE (SEM) = SD (1- reliability)1/2 Reliability (T-score) = 1 (SE/10)2 Reliability = 0.90 when SE = 3.2 95% CI = true score +/- 1.96 x SE 21
In the past 7 days I was grouchy [1st question] Never [39] Rarely [48] Sometimes [56] Often [64] Always [72] Estimated Anger = 56.1 SE = 5.7 (rel. = 0.68) 22
In the past 7 days I felt like I was ready to explode [2nd question] Never Rarely Sometimes Often Always Estimated Anger = 51.9 SE = 4.8 (rel. = 0.77) 23
In the past 7 days I felt angry [3rd question] Never Rarely Sometimes Often Always Estimated Anger = 50.5 SE = 3.9 (rel. = 0.85) 24
In the past 7 days I felt angrier than I thought I should [4th question] - Never Rarely Sometimes Often Always Estimated Anger = 48.8 SE = 3.6 (rel. = 0.87) 25
In the past 7 days I felt annoyed [5th question] Never Rarely Sometimes Often Always Estimated Anger = 50.1 SE = 3.2 (rel. = 0.90) 26
In the past 7 days I made myself angry about something just by thinking about it. [6th question] Never Rarely Sometimes Often Always Estimated Anger = 50.2 SE = 2.8 (rel = 0.92) 27
Thank you Finkleman, M. D. et al. (2010). Item selection and hypothesis testing for the adaptive measurement of change. Applied Psychological Measurement, 34, 238-254. Jabrayilov, R. et al. (2016). Comparison of classical test theory and item response theory in individual change assessment. Applied Psychological Measurement, 40, 559- 572. Wang, C., & Weiss, D. J. (2018). Multivariate hypothesis testing methods for evaluating significant individual change. Applied Psychological Measurement, 42, 221-239. drhays@ucla.edu (310-794-2294) Powerpoint file available for downloading at: http://gim.med.ucla.edu/FacultyPages/Hays/ 28


 Means and")


")