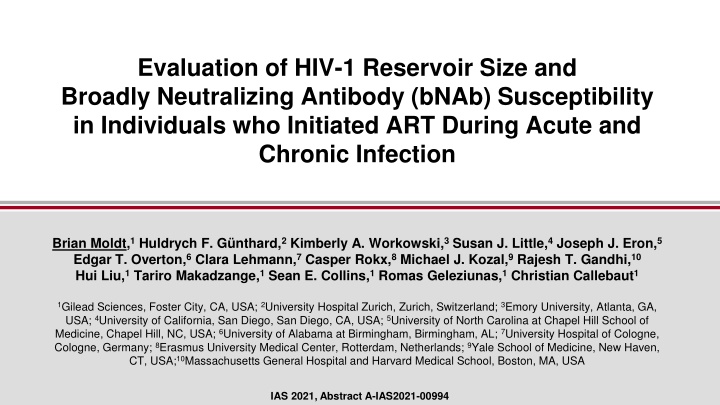
Evaluation of HIV-1 Reservoir Size and bNAb Susceptibility
This study examines HIV-1 reservoir size and susceptibility to broadly neutralizing antibodies in individuals who initiated antiretroviral therapy (ART) during acute or chronic infection. It investigates the impact of early ART initiation on reservoir characteristics, essential for developing effective cure strategies. The research includes a detailed analysis of the viral reservoir using various assays to provide insights into potential clinical trial designs.

Download Presentation

Please find below an Image/Link to download the presentation.
The content on the website is provided AS IS for your information and personal use only. It may not be sold, licensed, or shared on other websites without obtaining consent from the author.If you encounter any issues during the download, it is possible that the publisher has removed the file from their server.
You are allowed to download the files provided on this website for personal or commercial use, subject to the condition that they are used lawfully. All files are the property of their respective owners.
The content on the website is provided AS IS for your information and personal use only. It may not be sold, licensed, or shared on other websites without obtaining consent from the author.
E N D
Presentation Transcript
Evaluation of HIV-1 Reservoir Size and Broadly Neutralizing Antibody (bNAb) Susceptibility in Individuals who Initiated ART During Acute and Chronic Infection Brian Moldt,1Huldrych F. G nthard,2Kimberly A. Workowski,3Susan J. Little,4Joseph J. Eron,5 Edgar T. Overton,6Clara Lehmann,7Casper Rokx,8Michael J. Kozal,9Rajesh T. Gandhi,10 Hui Liu,1Tariro Makadzange,1Sean E. Collins,1Romas Geleziunas,1Christian Callebaut1 1Gilead Sciences, Foster City, CA, USA; 2University Hospital Zurich, Zurich, Switzerland; 3Emory University, Atlanta, GA, USA; 4University of California, San Diego, San Diego, CA, USA; 5University of North Carolina at Chapel Hill School of Medicine, Chapel Hill, NC, USA; 6University of Alabama at Birmingham, Birmingham, AL; 7University Hospital of Cologne, Cologne, Germany; 8Erasmus University Medical Center, Rotterdam, Netherlands; 9Yale School of Medicine, New Haven, CT, USA;10Massachusetts General Hospital and Harvard Medical School, Boston, MA, USA IAS 2021, Abstract A-IAS2021-00994
Disclosures Brian Moldt is an employee and stockholder of Gilead Sciences, Inc 2
Introduction Persistence of the viral reservoir is the main barrier to curing HIV Starting ART during acute HIV infection can limit the reservoir s size and diversity In depth characterization of the reservoir in individuals who initiate ART during acute infection will be critical for clinical trial design and cure strategies 3
Study Design Single visit, noninterventional study 1. Initiated ART during Fiebig I-II* HIV+ ART initiated during acute/chronic infection n=15/cohort 2. Initiated ART during Fiebig III-IV* 3. Initiated ART after seroconversion but 3 months within HIV test: Late acute 4. Initiated ART >6 months after estimated date of infection: Chronic Reservoir size assays Sequence of provirus and outgrowth virus Leukapheresis/ Large volume blood draw PBMCs/ CD4+ T cells *Fiebig et al. AIDS, 2003. 4
Baseline Characteristics Fiebig I-II n=16 43 (33, 49) Fiebig III-IV n=17 40 (32, 50) Late acute n=14 44 (30, 60) Chronic n=17 36 (30, 41) Age, years 16 (100) 80.5 (70.3, 85.2) 17 (100) 84.5 (73.7, 96.2) 11 (79) 81.3 (73.6, 98.1) 16 (94) 89.1 (79.2, 97.0) Male, n (%) Weight, Kg 4.1 5.0 3.0 5.7 Years from HIV diagnosis to Day 1 (1.4, 7.8) (3.1, 7.1) (2.0, 5.5) (3.3, 9.7) 4 12 (7, 14) 33 137 (70, 586) Days from HIV diagnosis to HIV treatment start (2, 8) (19, 56) 4.1 5.0 2.9 5.1 Years on ART (1.3, 7.8) (3.0, 7.0) (2.0, 5.2) (2.9, 6.6) 5.95 (5.40, 6.73) 5.88 (5.47, 6.69) 5.43 (4.67, 6.33) 4.44 (4.10, 4.75) Pre-ART HIV-1 RNA, log10 copies/mL 363 (285, 499) 298 (234, 430) 570 (399, 815) 456 (381, 622) Pre-ART CD4+ cell count, cells/ L 784 716 (675, 848) 913 824 (688, 968) CD4+ cell count at screening, cells/ L (636, 1109) (860, 1134) 1.28 (1.28, 1.28) 1.28 (1.28, 1.28) 1.28 (1.28, 1.28) 1.28 (1.28, 1.28) Plasma HIV-1 RNA at Day 1, log10 copies/mL All data median (Q1, Q3) unless otherwise specified. 5
Viral Reservoir for All Participants Reservoir evaluated by QVOA IPDA THDA 10000 Virus/million CD4 T cells 1000 100 10 1 0.1 0.01 Outgrowth virus Intact 3 del/hyp 5 del Total Total HIV DNA Viral reservoir size was recovered in ascending frequency by outgrowth virus < intact HIV DNA < 5 deleted HIV DNA < 3 deleted and/or hypermutated HIV DNA < total HIV DNA from THDA < total HIV DNA from IPDA 6 QVOA, Quantitative Viral Outgrowth Assay; IPDA, Intact Proviral DNA assay; THDA, Total HIV DNA assay
Viral Reservoir for All Participants per Fiebig I-II, Fiebig III-IV, Late Acute, and Chronic cohorts Cohort 1 Fiebig I-II Cohort 2 Fiebig III-IV 10000 10000 Virus per million CD4 T cells 1000 1000 Viral reservoir size assessments were recovered in the same ascending frequency regardless of time of ART initiation 100 100 10 10 1 1 0.1 0.1 0.01 0.01 Viral reservoir size was recovered in ascending frequency by outgrowth virus < intact HIV DNA < 5 deleted HIV DNA < 3 deleted and/or hypermutated HIV DNA < total HIV DNA from THDA < total HIV DNA from IPDA Cohort 3 Late acute Cohort 4 Chronic 10000 10000 Virus per million CD4 T cells 1000 1000 100 100 10 10 1 1 0.1 0.1 0.01 0.01 3 del /hyp 3 del /hyp Intact 5 del Total Intact 5 del Total QVOA QVOA THDA THDA IPDA IPDA 7
Association between Different Reservoir Assessments Intact vs Total (IPDA) Intact vs Total (THDA) Intact vs QVOA 10000 10000 10 Total HIV DNA per million CD4 T cells Total HIV DNA per million CD4 T cells rs=0.6966 P<0.0001 rs=0.3268 P=0.0324 rs=0.3543 P=0.0340 1000 1000 1 IUPM 100 100 0.1 10 1 10 0.01 0.1 1 10 100 1000 0.1 1 10 100 1000 0.1 1 10 100 1000 Intact HIV DNA per million CD4 T cells Intact HIV DNA per million CD4 T cells Intact HIV DNA per million CD4 T cells Total (IPDA) vs QVOA Total (THDA) vs QVOA Total (IPDA) vs Total (THDA) 10 10 10000 Total HIV DNA per million CD4 T cells rs=0.7523 P<0.0001 rs=0.4487 P=0.0061 rs=0.4045 P=0.0217 1 1 1000 IUPM IUPM 100 0.1 0.1 10 0.01 0.01 10 Total HIV DNA per million CD4 T cells (IPDA) 100 1000 10000 10 100 1000 10000 10 100 1000 10000 Total HIV DNA per million CD4 T cells Total HIV DNA per million CD4 T cells Intact HIV DNA, total HIV DNA from IPDA, total HIV DNA from THDA, and QVOA all demonstrated a significant association 8 Associations assessed by Spearman s correlations
Viral Reservoir per Cohort by Total HIV DNA Assay p=0.0214 p=0.0329 10000 Total HIV DNA from THDA, p=NS per million CD4 T cells 1000 100 nd 10 Fiebig I-II Fiebig III-IV Late acute Chronic Smaller total HIV DNA was measured in Fiebig I-IV vs chronic cohorts No difference in total HIV DNA was observed between late acute and chronic cohorts 9 Cohort comparison by two-sided Wilcoxon rank sum tests; nd, not detected
Viral Reservoir per Cohort by IPDA Intact 3 del/hyp p=NS p=0.0382 p=NS p=0.0137 Virus/million CD4 T cells 10000 10000 p=NS p=NS 1000 1000 Smaller 5 del, 3 del/hyp, and total HIV DNA were measured in Fiebig I-IV vs chronic cohorts No significant difference was observed for intact HIV DNA between Fiebig I-IV vs chronic cohorts No significant difference (except for 5 del) in reservoir size was observed for any measurements between late acute and chronic cohorts 100 100 10 10 nd nd 1 1 5 del Total p=0.0107 p=0.0073 p=0.0195 p=0.0042 10000 10000 p=NS p=0428 Virus/million CD4 T cells 1000 1000 100 100 10 10 nd nd 1 1 Fiebig I-II Fiebig III-IV Late acute Fiebig I-II Fiebig III-IV Late acute Chronic Chronic 10 Cohort comparison by two-sided Wilcoxon rank sum tests; nd, not detected
Viral Reservoir per Cohort by QVOA p=NS p=NS 10 p=NS 1 IUPM 0.1 nd 0.01 Fiebig I-II Late acute Fiebig III-IV Chronic No significant difference in outgrowth virus was observed between any of the cohorts 11 Cohort comparison by two-sided Wilcoxon rank sum tests; nd, not detected
Reservoir Diversity per Cohort by Average Pairwise Distance Analysis of HIV Envelope PBMC Virus Outgrowth Virus p=0.002 p=0.0002 3.0 p=0.01 p=0.009 200 p=NS p=0.001 Average pairwise distance 2.5 150 2.0 1.5 100 1.0 50 0.5 0.0 0 Fiebig I-II n=7 Fiebig III-IV n=7 Late acute n=7 Fiebig I-II n=7 Fiebig III-IV n=9 Late acute n=8 Chronic n=13 Chronic n=16 Smaller reservoir diversity was observed in participants who initiated ART during acute (Fiebig I-II, Fiebig III-IV and Late acute) than in chronic infection 12 Cohort comparison by two-sided Wilcoxon rank sum tests; Envelope sequencing done by Illumina MiSeq next-generation sequencing (proviral DNA/PBMCs and RNA from QVOA outgrowth virus; HIV proviral DNA diversity in PBMCs assessed with sliding window (envelope gene); Outgrowth viruses diversity assessed on full-length envelope for participants with 2-54 outgrowth viruses
Reservoir Virus Susceptibility to bNAbs: PGT121, EVM and 10-1074 PBMC Virus Outgrowth Virus 20 20 15 15 Participants, n Sensitive Resistant 10 10 5 5 0 0 Fiebig III-IV n=9 Late acute n=8 Fiebig III-IV n=11 Late acute n=7 Fiebig I-II n=7 Fiebig I-II n=10 Chronic n=16 Chronic n=13 bNAb susceptibility for PBMC viruses was generally higher in participants who initiated ART during acute (Fiebig I-II, III-IV and Late acute) than in chronic infection No apparent pattern was observed for outgrowth virus 13 Viral sensitivity to PGT121, EVM (elipovimab) and 10-1074 based on the presence of N332 glycan and D325 residue in the HIV envelope
bNAb Susceptibility for PBMC virus and Outgrowth Virus Number of participants with bNAb sensitive/resistant PBMC virus and outgrowth virus PBMC virus: S Outgrowth virus: S PBMC virus: R Outgrowth virus: R PBMC virus: S Outgrowth virus: R PBMC virus: R Outgrowth virus: S 0 0 Fiebig I-II, n=5 3 2 0 0 Fiebig III-IV, n=8 7 1 0 0 Late acute, n=5 4 1 0 Chronic, n=13 4 4 5 bNAb susceptibility was generally in agreement between PBMC virus and outgrowth virus for participants that initiated ART during acute infection (Fiebig I-II, III-IV and Late acute) Five individuals that initiated ART during chronic infection (Chronic) had a discrepancy as the PBMC virus was resistant and the outgrowth virus was sensitive 14 Only participants with data from both PBMC virus and from outgrowth virus included in analysis
Conclusions Participants who initiated ART during Fiebig I-II and Fiebig III-IV compared to participants who initiated ART during chronic infection had: Lower levels of total HIV DNA (no difference in intact HIV DNA or outgrowth virus) Lower viral diversity Higher susceptibility to bNAbs Individuals initiating ART during Fiebig I-IV would be an optimal target population for proof-of- concept HIV cure trials due to smaller, less diverse HIV reservoirs 15
Acknowledgments We are grateful to all the individuals who participated in this trial, their partners and families The investigators and their study teams Huldrych F. G nthard, Kimberly A. Workowski, Susan J. Little, Joseph J. Eron, Edgar T. Overton, Clara Lehmann, Casper Rokx, Michael J. Kozal, Rajesh T. Gandhi Accelevir Diagnostics for reservoir analyses Seq-IT for sequence analyses These studies were funded by Gilead Sciences, Inc. 16