The study focuses on evaluating various loss functions for segmenting mammography images, aiming to improve the performance of deep learning methods. It reviews strengths and weaknesses, categorizes different loss functions, and proposes a method for analyzing their effectiveness on mammogram datasets.
Please find below an Image/Link to download the presentation.
The content on the website is provided AS IS for your information and personal use only. It may not be sold, licensed, or shared on other websites without obtaining consent from the author. If you encounter any issues during the download, it is possible that the publisher has removed the file from their server.
You are allowed to download the files provided on this website for personal or commercial use, subject to the condition that they are used lawfully. All files are the property of their respective owners.
The content on the website is provided AS IS for your information and personal use only. It may not be sold, licensed, or shared on other websites without obtaining consent from the author.
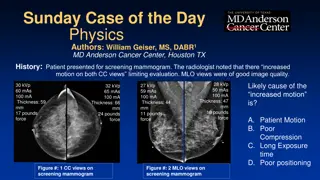
Image Segmentation The process of partitioning an image into multiple (meaningful) regions. Mass segmentation segments mammographies image to masses and background. 2
Introduction The performance of mass segmentation have improved substantially due to the advancement of deep learning. Loss function is one of the key components contributing to the performance of a deep learning based method. There is a surge in loss functions targeting different challenges in mass segmentation. There are reviews of strengths and weaknesses of different losses generally. However, there is no comprehensive review and evaluation of loss functions on mammograms. 3
Related Work A segmentation. comprehensive review of loss functions used in medical image Categorized loss functions into four groups: distribution-based loss functions region-based loss functions boundary-based loss functions compounded loss functions Discuss the advantages and disadvantages of each loss functions and provides recommendations on how to select the suitable loss function. Highlighted relationships among existing loss functions. Suggests that compound loss functions are better suited for medical image segmentation tasks. J. Ma, Segmentation loss odyssey. [Online]. Available: http: //arxiv.org/abs/2005.13449- 2020. 4
Related Work Jadon has explored various loss functions used in semantic segmentation Categorized loss functions into four groups: distribution-based loss functions region-based loss functions boundary-based loss functions compounded loss functions Discusses the advantages, disadvantages, and use of each loss function Suggests that it s impossible to have a universal loss function, and the best loss function mostly depends on the dataset. S. Jadon. A survey of loss functions for semantic segmentation. [Online]. Available: https://arxiv.org/abs/2006.14822v4-2020. 5
Proposed Method Categorize loss functions based challenges they target and compare the performances. Review and compare more that 25 loss functions on mammogram segmentation. Evaluate loss functions on mammography datasets including: INbreast CBIS-DDSM Mini-MIAS Official implementations of losses will be used. Will implement losses without implementations. Might need adaptations for some losses like boundary loss. Analyze the performance of different losses on mammogram datasets. Evaluate the loss functions on different architectures for each dataset. 6
Challenges :Class Imbalance In mass segmentation tasks, the number of pixels belonging to the foreground class (e.g., mass) is often much smaller than the number of pixels belonging to the background class. This class imbalance can make it difficult for the model to learn to distinguish between foreground and background pixels. .Masses may take less than one percent of the image. 7
Challenges :False Positive and Negative The amount of false positive and false negative is another challenge that loss functions could be useful in eliminating them. Specifically when the results will be used for treatments. False positive and false negative are important factors. 8
Challenges :Breast Density Categories Based on ACR breast density could be categorised into four groups from fatty to dense based on the presence of glandular and fibrous tissues. The higher density classes are more challenging to segment. Samples with low and high density categories. 9
Dice Loss Designed to address class imbalance in image segmentation tasks. Penalizes the model more heavily for misclassifying foreground pixels than background pixels. It has been shown to be effective in a variety of image segmentation tasks. It can be more sensitive to noise and outliers than cross-entropy loss. It can be more difficult to tune the hyperparameters of Dice loss than cross- entropy loss. Y represents the ground truth or true positive region (the target). Y` represents the predicted positive region (the model's output). 10
Focal Loss A variation of Binary Cross-Entropy. It down-weights the contribution of easy examples and enables the model to focus more on learning hard examples. Works well for highly imbalanced class scenarios. ptis the predicted probability that the example is positive is a hyperparameter that controls the focus on hard examples If is equal to 0, then focal loss is equivalent to cross-entropy loss. if is greater than 0, then focal loss will down-weight the loss for easy examples. 11
Tversky Loss Based on the Tversky index, which is a generalization of the Jaccard index and Dice coefficient. Measures the similarity between two sets, considering both false positives (FP) and false negatives (FN). Y represents the ground truth or true positive region (the target). Y` represents the predicted positive region (the model's output). is the weight associated with false positives. is the weight associated with false negatives. 12
Timeline November 8: Review the loss functions for the segmentation task and implement them according to the papers (if the implementation is not publicly available). November 16: Reprocess the datasets for segmentation of mammography images, including INbreast, CBIS-DDSM, and mini-MIAS. November 24: architecture, including U-Net and more (we will select them based on the review of the literature in the future). Training and testing the losses using commonly used December 2: Design the synthesis dataset for different challenges in the datasets. December 10: Designing and performing the tests of the losses on the synthetic datasets. December 20: Analyzing the findings and completing the report of the project. 13