Examining Sampling Bias in Big Data Using a 1936 Election Case Study
Explore how sampling bias in big data can affect survey outcomes through an analysis of the Readers Digest poll of the 1936 election. Discover flaws in the sampling method and understand why it led to inaccuracies in predicting the election results.
Download Presentation

Please find below an Image/Link to download the presentation.
The content on the website is provided AS IS for your information and personal use only. It may not be sold, licensed, or shared on other websites without obtaining consent from the author. If you encounter any issues during the download, it is possible that the publisher has removed the file from their server.
You are allowed to download the files provided on this website for personal or commercial use, subject to the condition that they are used lawfully. All files are the property of their respective owners.
The content on the website is provided AS IS for your information and personal use only. It may not be sold, licensed, or shared on other websites without obtaining consent from the author.
E N D
Presentation Transcript
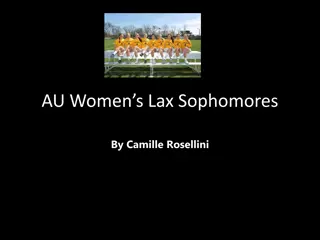
THE EFFECT OF SAMPLING BIAS ON BIG DATA BY USING THE READERS DIGEST POLL OF THE 1936 ELECTION AS A CASE STUDY, WE EXAMINE HOW THE SAMPLE OF DATA USED AFFECTS THE OUTCOME OF THE SURVEY. Rachel Heymach CS46 Jennifer Widom Akash Das Sarma
BACKGROUND HISTORY Before the 1936 poll, Readers digest was known for their unprecedented accuracy in predicting presidential elections, including the election of 1932 which was correct and was within 1% of the recorded poll results. During the 1930 s, the US was in the middle of the great depression.
HOW THE SURVEY WAS CONDUCTED Reader s Digest sent out 10 million mock ballots to a randomized sample from lists such as phone directories, club membership lists, and magazine subscriptions. This sample is very large and contained almost a tenth of the population (although they claim that it represented 1 in 4). From there they used the data collected from the 2.4 million surveys sent back to determine that Landon was going to win over Roosevelt with 57% to 43% respectively.
THE DATA Chart from http://historymatters.gmu.edu/d/5168/
DOES ANYONE ELSE SEE FLAWS??? Flaw #1: The sample selected was from phone directories and magazine subscriptions. In 1936. During the depression. Many people were homeless during this time and telephones were considered luxuries for even the people who managed to keep their homes. This type of sample bias comes into play when the sample selected (mainly middle-upper class citizens in this case) do not properly represent the population you are predicting the outcome for (the entire US population).
DOES ANYONE ELSE SEE FLAWS??? Flaw #2: out of 128 million people in the US in 1936, 10 million people were asked to respond, of that 10 million only 2.4 million mailed back their surveys. This flaw in the poll is called nonresponse bias and actually resulted for two reasons. The first reason is that with mail surveys, the mock ballot could have been seen as another random piece of junk mail and thrown away. The second reason, bringing a more substantial bias is due to the fact that people with stronger opinions are often the ones to share them and people who are shy or unsure of their actions won t respond as often.
THE RESULT As expected, since the sample was not representative of the population, the sample poll did not accurately depict the national population s poll in 1936. Reader s Digest had a record high of 19% in sampling error, the greatest error of any major public opinion poll.
HOW TO AVOID SAMPLE BIAS It is important when creating your sample for big data projects that the sample is as close to unbiased as possible. Phone surveys are cheaper but less affective as in person surveys. Surveys of convenience occur when the sample is not random, rather just taken in the simplest way possible. As mentioned earlier, call in and mail surveys often result in nonresponse bias and only show the strongest of opinions instead of a more distributed spread. Larger samples result in more precise data with smaller standard deviations but only when the sample in unbiased. It is often better to have an unbiased smaller sample than to have a large bias sample as the size often just increases the errors caused by the sampling bias.
THANK YOU INTERNET (SOURCES) https://www.math.upenn.edu/~deturck/m170/wk4/lecture/case1.html http://www.jstor.org/stable/2749114?seq=4#page_scan_tab_contents http://historymatters.gmu.edu/d/5168/ https://www.ma.utexas.edu/users/mks/statmistakes/biasedsampling.html http://www.mnforsustain.org/united_states_population_growth_graph.htm http://www.history.com/topics/great-depression

