Exciting Mathematics Course at St. Mary's Sixth Form
Dive into a stimulating mathematics course at St. Mary's Sixth Form & Leadership Centre focusing on topics like Linear Programming, Probability, Statistics Applications, and Sequences & Growth. Enhance your analytical skills and tackle real-world problems with hands-on exercises and collaborative learning. Explore the impact of air quality on COVID cases, analyze data patterns, and solve practical scenarios related to linear equations and probabilities. Join us for a dynamic learning experience!

Download Presentation

Please find below an Image/Link to download the presentation.
The content on the website is provided AS IS for your information and personal use only. It may not be sold, licensed, or shared on other websites without obtaining consent from the author.If you encounter any issues during the download, it is possible that the publisher has removed the file from their server.
You are allowed to download the files provided on this website for personal or commercial use, subject to the condition that they are used lawfully. All files are the property of their respective owners.
The content on the website is provided AS IS for your information and personal use only. It may not be sold, licensed, or shared on other websites without obtaining consent from the author.
E N D
Presentation Transcript
St Marys Sixth Form & Leadership Centre Sixth Form Subject Taster A Level/BTEC SUBJECT EXAM BOARD COURSE CODE Aspire Challenge - Succeed
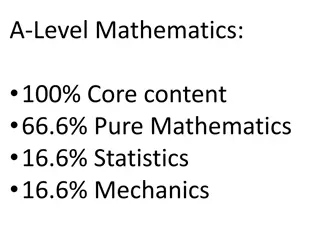
Course Breakdown Four main topics Linear programming Probability Application of statistics Sequences and Growth 80% of the content will draw from GCSE content. The rest will be from above and beyond GCSE. Early focus will be on you mastering the maths, but we will quickly move onto using it in context.
Course Breakdown: Applications of Statistics Moving Averages Boxplots Standard deviation and variance Histograms Product moment correlation Spearman s rank What effect do you think air quality has on the seriousness of COVID cases? What sort of data would you need to analyse this? How would you analyse it?
Course Breakdown: Linear Programming Forming and solving linear equations Linear functions Simultaneous equations Linear inequalities Linear programming After how many years would an electric vehicle, which costs 25 000 pounds to purchase and 5 pounds a week to charge, be more affordable than a petrol car which costs 20 000 pounds to purchase and 10 pounds a week to refill
Course Breakdown: Probability Theoretical and relative probability 2 way tables and frequency trees Venn diagrams Notation Risk There are certain insurance companies that charge less per month if their customers can show that they eat healthily and exercise often. Why?
Course Breakdown: Sequence and Growth Exponential growth Graphs and modelling Sequences Series Latest figures put the UK s r value at 1.2. This means that, on average, every 10 people infected with COVID will infect 12 other people per day. How long will it take for the number of infected people to double? https://www.gov.uk/guidance/the-r-value-and-growth-rate
Mode of Study Your teacher will You will Take notes Attempt exercises yourself Discuss your understanding with the classmates Work together on real world problems Keep your notes organized, with the ultimate goal of using them for revision Introduce topics to you Supply you with printed notes, or ask you to copy down notes Model examples to you, and talk through the problem solving process Ask questions frequently to make sure you understand Provide you with links to real world contexts
Independent Study You will receive homework every week. You may need to do more than the homework if you are struggling with the current topic. There are tests throughout the year that you will need to prepare for.
Equipment Scientific calculator Pencils Eraser Pens 30 cm ruler File Lined paper Sleeves
Cross Curricular Links Spearman s rank is used in Geography to measure the correlation between variables The probability of random events is central in understanding radioactivity in Physics Risk of injury is carefully assessed in sports science
Follow us on @SMHSixth ASPIRE - CHALLENGE - SUCCEED