Experimental Evidence on Career Academies in High Schools
Recent study on contemporary career academies in high schools focusing on improving student outcomes. The study explores the impact of career academies on postsecondary success and graduation rates. Wake County Public School System's data from 2009-2016 is analyzed to understand the effects of career academies on students.
Download Presentation

Please find below an Image/Link to download the presentation.
The content on the website is provided AS IS for your information and personal use only. It may not be sold, licensed, or shared on other websites without obtaining consent from the author. If you encounter any issues during the download, it is possible that the publisher has removed the file from their server.
You are allowed to download the files provided on this website for personal or commercial use, subject to the condition that they are used lawfully. All files are the property of their respective owners.
The content on the website is provided AS IS for your information and personal use only. It may not be sold, licensed, or shared on other websites without obtaining consent from the author.
E N D
Presentation Transcript
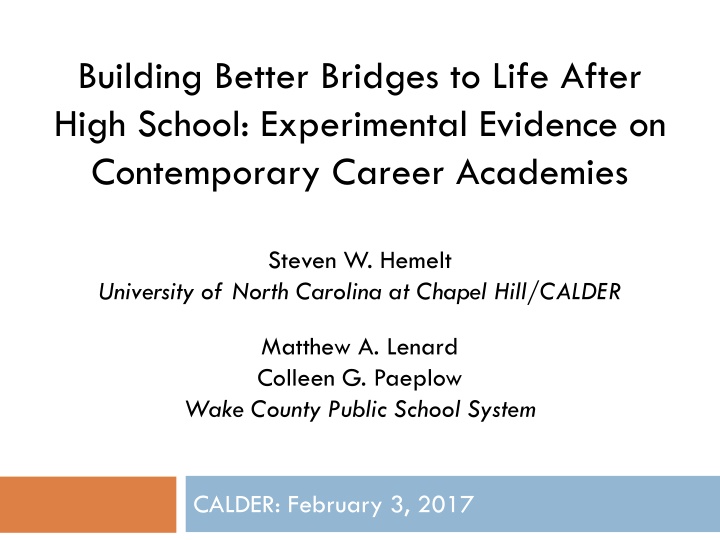
Building Better Bridges to Life After High School: Experimental Evidence on Contemporary Career Academies Steven W. Hemelt University of North Carolina at Chapel Hill/CALDER Matthew A. Lenard Colleen G. Paeplow Wake County Public School System CALDER: February 3, 2017
High School Completion About 20% of students fail to finish high school (NCES, 2015) Dim labor market prospects for those without a HS diploma Projections forecast continued growth for middle- skill jobs that require some form of postsecondary training (Carnevale et al., 2013; Holzer, 2012; 2014) Causal evidence on interventions capable of boosting HS graduation is very thin (Murnane, 2015)
Career Academies Aim to improve attachment to and performance in high school while exposing students to options for postsecondary study and work Contemporary career academies place particular emphasis on college-going/continued training part of this goal Existing work largely reflects older era: Before recession Before NCLB and its accountability requirements Before Common Core and adoption of college- and career-ready standards for all students Sometimes a holding tank for lower-performing students
Career Academies Little work exploring causal effects of participation in contemporary career academies on educational outcomes. MDRC: Group of academies that operated during the 1990s No effects on high school graduation or college-going (Kemple, 2001) Increased labor market earnings for men (Kemple & Willner, 2008)
Our Study Wake County Public School System (WCPSS) Administrative data from 2009-10 to 2015-16 Contributions: Characterize the profile of students enrolling in the district s extensive system of career academies. 1) Exploit lottery-based admissions of one, technology-focused career academy to estimate causal effects of attendance on high school and postsecondary outcomes. 2)
Wake County: Career Academies 1st academy = 1990 Slow growth in 1990s and 2000s Rapid, recent growth since 2000 Today = 20 academies AOIT
Profile of Academy Enrollees All Students Technology Academies 9th Graders in Wake County Non-CA 9th Graders in Same HS 9th Grade CA Enrollees 9th Grade CA Enrollees Variable Female 0.50 0.45 0.49 0.41 Black, non-Hispanic 0.25 0.20 0.29 0.13 Hispanic 0.15 0.09 0.16 0.05 White, non-Hispanic 0.48 0.57 0.45 0.71 Asian, non-Hispanic 0.07 0.10 0.07 0.07 8th Grade Math Score (std) 0.009 (0.999) 0.427 (0.931) 0.005 (1.046) 0.517 (0.889) 8th Grade Reading Score (std) 0.002 (0.999) 0.316 (0.870) -0.015 (1.070) 0.360 (0.873) Academically Gifted (M or R) 0.28 0.43 0.31 0.46 N(students) 20,968 993 5,524 309 Notes: Analytic sample includes first-time 9th graders in WCPSS in 2014-15 and 2015-16. Standard deviations of continuous variables appear in parentheses.
Academy Enrollment Predictors Outcome = Enroll in CA in 9th Grade .01 .02 .03 .04 .05 Change in Likelihood of CA Enrollment 0 -.05 -.04 -.03 -.02 -.01 LEP Female Asian Black Hispanic Special Education 8th Grade Math 8th Grade Reading Notes: Analytic sample includes first-time 8th graders in WCPSS in 2013-14 and 2014-15. Model includes middle school fixed effects and indicators for 8th grade cohort.
Apex Academy of Information Technology (AOIT) Oversubscribed! Lots of interest, limited capacity Use lottery to fairly select incoming cohorts Approximates randomized experiment Allows us to estimate causal effects: Lottery winners and losers should be the same in all ways except one: opportunity to attend AOIT Data: 4 cohorts of 9th grade applicants to AOIT: 2009-2010 to 2012-2013 (N = 469 students) WCPSS administrative data National Student Clearinghouse (NSC) data
As good as random? Applicants Female Losers Winners Applicants Math Score Losers Winners Applicants Non-White Losers Winners 0 .2 .4 .6 .8 Share or Standardized Score
AOIT: Treatment-Control Contrast AOIT Enrollees ( Treatment ) Apex HS Non-AOIT Enrollees ( Control ) Not available to non-AOIT students Dimension Paid internship in 11th grade; Job shadowing and career-development day- trips Work-based Learning; Workplace Engagement Non-Academic Supports Networking through local Chamber of Commerce, resume preparation, mock interviews, job shadowing, and pre- internship training Not available to non-AOIT students Curriculum Cohort-based progression; project-based learning; teachers of CTE and academic courses collaborate during common, weekly planning time No cohort-based structure to curriculum IT Courses (required electives) Sequence of courses that reflects one of two themes: programming or multimedia/web design (= 1/3 of content) Limited availability to non-AOIT students (5% to 10% of course enrollees drawn from wider high school) No special encouragement or 12th grade course requirements Bridge to Postsecondary Study Students take college-level IT course (either AP or articulated) during 12th grade
High School Graduation 12.0 Percentage Point Change in High School 10.0 ** ** 8.0 ** Graduation Rate ** 6.0 4.0 2.0 0.0 ALL MALE FEMALE STUDENTS -2.0 Effect of Lottery Offer (ITT) Effect of Enrolling in AOIT (TOT) Notes: *** p<0.01, ** p<0.05, * p<0.1.
Student Engagement: 9th Grade Absences All Students Number of days absent, 9th Grade Share of days absent, 9th Grade Absence rate >= 50th pctile Absence rate >= 95th pctile Independent variable A. Effect of Winning Lottery (ITT) Won lottery (1) (2) (3) (4) -1.194** (0.579) -0.007** (0.003) -0.047 (0.046) -0.037* (0.020) B. Effect of Enrolling in Career Academy (TOT) Enrolled in AOIT -1.430** (0.630) -0.008** (0.003) -0.056 (0.055) -0.044* (0.026) 3.78 469 0.02 469 0.61 469 0.07 469 Outcome mean, control group N(students)
Achievement & Advanced Course- taking No effects of academy enrollment on ACT Composite score, ACT Math score, or ACT Reading score Likelihood of taking an AP course (any), an AP Math/Science course Sitting for an AP exam Success on AP exam (= scoring 3 or higher) Punchline: Academy enrollees perform as well as their non-academy counterparts.
Unpacking the HS Graduation Effect Outcome = High school graduation (on-time, expected) Include controls for potential mechanisms Preferred specification (Table 5, col 3) 9th Grade Attendance Advanced HS Course-taking HS Test Scores Independent variable A. Effect of Enrolling in Career Academy (TOT) (1) (2) (3) (4) 0.078*** (0.029) 0.063** (0.029) 0.063** (0.027) 0.062** (0.027) Enrolled in AOIT Reduction in impact of CA enrollment: % explained by 9th grade absences 19 % explained by 9th grade absences, advanced HS course-taking 19 % explained by 9th grade absences, advanced HS course-taking, HS test scores 21 469 469 469 469 N(students)
College Enrollment 15.0 ** Percentage Point Change in College-going Rate ** 10.0 * * 5.0 0.0 ALL MALE FEMALE STUDENTS -5.0 Effect of Lottery Offer (ITT) Effect of Enrolling in AOIT (TOT) Notes: *** p<0.01, ** p<0.05, * p<0.1.
Conclusions and Caveats Enrollees in modern-day career academies across Wake County are higher performing than their non-academy peers. Female, Hispanic, and LEP students are less likely to enroll in an academy than others. Participation in technology-based academy increases high school graduation and college-going, with attainment gains concentrated among males. Improved attendance in 9th grade accounts for roughly 1/5th of HS graduation effect. One academy in lottery-based analysis limited external validity Paints paths for future research Existence proof for the potential of high-quality academies to influence high school completion and college-going
Next Steps Integrate additional academies as they adopt lottery-based admissions Labor market data?!? Fingers crossed Does academy participation affect the likelihood that a student works while enrolled in college?


