Experimental Soil Properties and Degradation of Chlorpyrifos
The experimental soil properties, including physical and chemical characteristics, along with the degradation process of chlorpyrifos, a pesticide, are detailed in the provided data. Changes in soil parameters, enzymatic activities under different treatments, and variations in soil chemical parameters are discussed.

Download Presentation

Please find below an Image/Link to download the presentation.
The content on the website is provided AS IS for your information and personal use only. It may not be sold, licensed, or shared on other websites without obtaining consent from the author.If you encounter any issues during the download, it is possible that the publisher has removed the file from their server.
You are allowed to download the files provided on this website for personal or commercial use, subject to the condition that they are used lawfully. All files are the property of their respective owners.
The content on the website is provided AS IS for your information and personal use only. It may not be sold, licensed, or shared on other websites without obtaining consent from the author.
E N D
Presentation Transcript
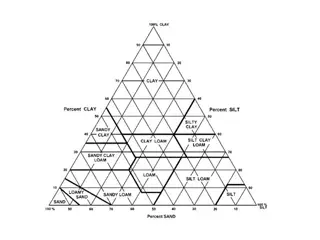
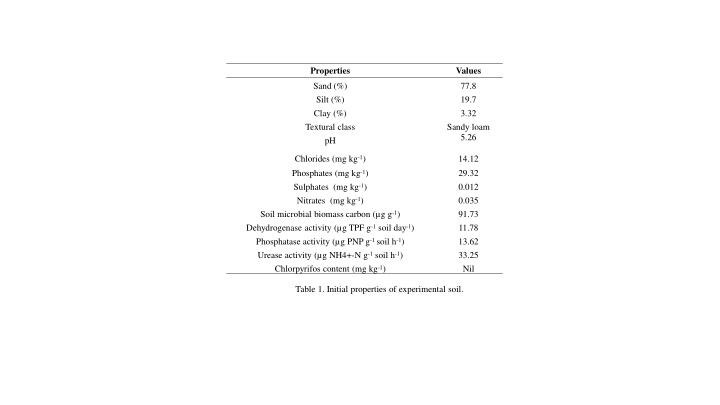
Properties Values Sand (%) Silt (%) Clay (%) Textural class pH 77.8 19.7 3.32 Sandy loam 5.26 Chlorides (mg kg-1) Phosphates (mg kg-1) Sulphates (mg kg-1) Nitrates (mg kg-1) Soil microbial biomass carbon ( g g-1) Dehydrogenase activity ( g TPF g-1soil day-1) Phosphatase activity ( g PNP g-1 soil h-1) Urease activity ( g NH4+-N g-1soil h-1) Chlorpyrifos content (mg kg-1) 14.12 29.32 0.012 0.035 91.73 11.78 13.62 33.25 Nil Table 1. Initial properties of experimental soil.
Sulphates (meq 100g-1) Chlorides (mg kg-1) Phosphates (mg kg-1) Nitrates (meq 100g-1) Variants pH Soil microbial biomass carbon ( g g-1) 90.14 84.38 19.70* 0.0002 5th day 60th day t value P value 5.14 5.02 6.69* 0.002 14.2 22.72 6* 0.003 29.36 29.46 0.087 0.935 0.016 0.032 7.516* 0.0016 0.043 0.061 1.006 0.371 Table 2. Changes in soil parameters during natural degradation of chlorpyrifos in soil
Urease (g NH4+- N g-1soil h-1) Dehydrogenase ( g TPF g-1 soil day-1) Phosphatase ( g PNP g-1 soil h-1) Treatments 7.83c 12.04g 28.58d T1 (control) 10.21b 12.16g 30.91bc T2 (H2O2) 10.33b 8.59c 11.74a 11.43a 11.37a 8.37c 8.25c 10.26b 0.289 1.16 14.48de 12.49fg 15.79bc 17.06a 16.53ab 14.70cd 12.28g 13.54ef 0.392 1.57 28.58d 29.16d 35.58a 35.00a 36.16a 31.50b 29.75cd 31.50b 0.452 1.81 T3 (Fenton) T4 (H2O2 + Fenton) T5 (P.F) T6 (T.V) T7 (P. F+T.V) T8 (Sun light) T9 (UV light) T10 (Sun +UV) SE(m) CD (0.01) Table 3. Effect of treatments on various enzymatic activities in soil incubated with chlorpyrifos. T1:Control; T2:Hydrogen peroxide-5%; T3: Fenton reagent -0.5%; T4: Hydrogen peroxide-5% + Fenton reagent -0.5%; T5: Pseudomonas fluorescens; T6: Trichoderma viride; T7: Pseudomonas fluorescens + Trichoderma viride; T8: Sunlight 6 hr; T9:Ultra violet 4 hr; T10: Sunlight 6 hr + Ultra violet 4 hr. SE(m): Standard error (mean), CD: critical difference NS: Non significance
Chlorides (mg kg-1) 21.3 23.66 26.03 26.03 28.4 28.4 30.76 23.66 23.66 26.03 1.98 NS Phosphates (mg kg-1) 28.86d 30.36bc 30.67b 29.60cd 31.80a 31.76a 31.30ab 29.44cd 29.10d 29.66cd 0.336 1.35 Sulphates (meq 100g-1) 0.035 0.038 0.033 0.038 0.039 0.042 0.046 0.037 0.034 0.039 0.003 NS Nitrates (meq 100g-1) 0.058 0.073 0.058 0.058 0.073 0.088 0.073 0.088 0.058 0.073 0.013 NS Treatments T1 (control) T2 (H2O2) T3 (Fenton) T4 (H2O2 + Fenton) T5 (P.F) T6 (T.V) T7 (P. F+T.V) T8 (Sun light) T9 (UV light) T10 (Sun +UV) SE(m) CD (0.01) pH 5.00d 4.97e 4.96e 4.93f 5.07a 5.08a 5.06ab 5.02cd 5.03bcd 5.09abc 0.012 0.048 Table 4. Changes in chemical parameters of soil under various treatments during chlorpyrifos degradation T1:Control; T2:Hydrogen peroxide-5%; T3: Fenton reagent -0.5%; T4: Hydrogen peroxide-5% + Fenton reagent -0.5%; T5: Pseudomonas fluorescens; T6: Trichoderma viride; T7: Pseudomonas fluorescens + Trichoderma viride; T8: Sunlight 6 hr; T9:Ultra violet 4 hr; T10: Sunlight 6 hr + Ultra violet 4 hr. SE(m): Standard error (mean), CD: critical difference NS: Non significance