Exploratory Data Analysis in STA 101 Spring 2019
Dive into exploratory data analysis techniques in the STA 101 Spring 2019 course at Duke University, covering topics like single numerical variable visualization, robust statistics, box plots, and more. Get ready for readiness assessments, application exercises, and learning about data distributions.

Download Presentation

Please find below an Image/Link to download the presentation.
The content on the website is provided AS IS for your information and personal use only. It may not be sold, licensed, or shared on other websites without obtaining consent from the author. If you encounter any issues during the download, it is possible that the publisher has removed the file from their server.
You are allowed to download the files provided on this website for personal or commercial use, subject to the condition that they are used lawfully. All files are the property of their respective owners.
The content on the website is provided AS IS for your information and personal use only. It may not be sold, licensed, or shared on other websites without obtaining consent from the author.
E N D
Presentation Transcript
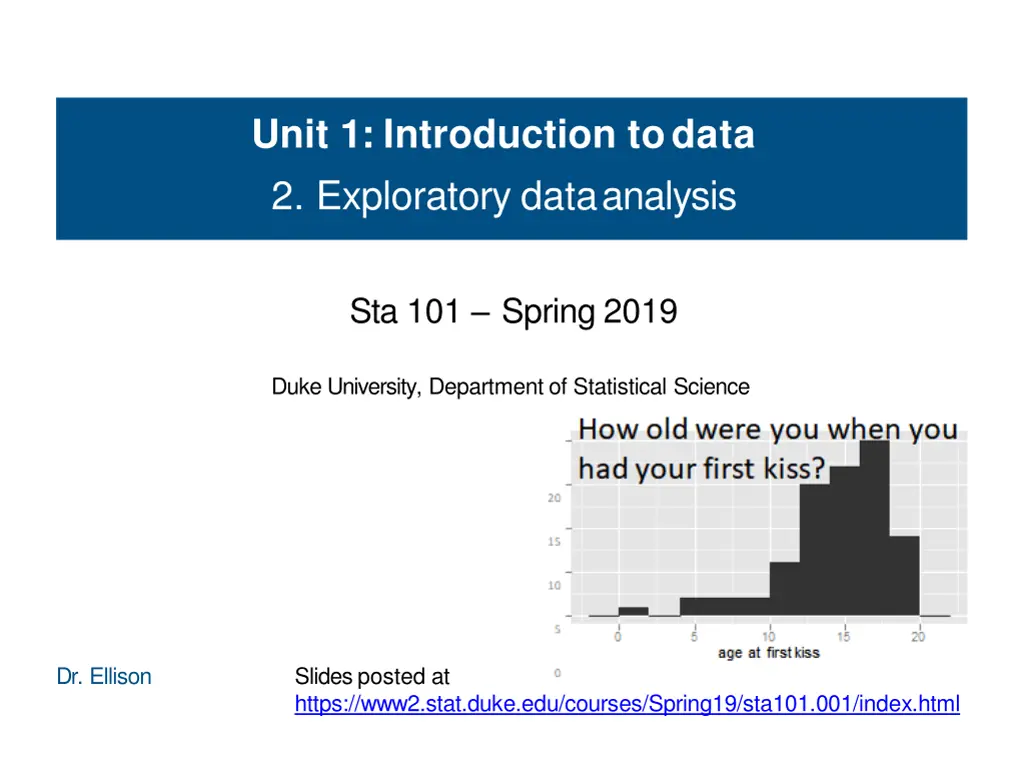
Unit 1: Introduction todata 2. Exploratory dataanalysis Sta 101 Spring 2019 Duke University, Department of Statistical Science Dr. Ellison Slides posted at https://www2.stat.duke.edu/courses/Spring19/sta101.001/index.html
Register your Clicker! To do now: 1. 2. 3. Turn on your clicker (orange button) Wait about 6 seconds. IF your clicker says READY, : a) Look for when your name appears on the slides. (If you don t see your name and you are officially enrolled in the course let me know!) b) When you see your name, type the 4 letters you see under it (you have 15 seconds). c) If your name box turned another color, your clicker should now be registered to the class! IF your clicker does not say READY : 1. Hold down on the orange button until the clicker screen changes. 2. Quickly press AA. 3. Wait ~6 seconds. 4. Your screen should now say READY . (If not, ask a TA for help!) 4. We will be registering clickers 1/14, 1/16, 1/23 clicker grading begins on 1/28!
Readiness assessment Individual: 15 minutes, usingclickers Team: 10 minutes, using scratch off sheets (1 per team) 1
Summary of main ideas To Do: 1. Getting to Know you Survey + Pretest due tomorrow 1/15 2. Start working on Problem Set 1 (Due Friday 1/26) 16
Outline I. Readiness assessment II. Housekeeping III. Main ideas 1. Analysis work flow: 1. visualization Single Numerical Variable 1. discuss shape, center, spread, and unusual observations 2. Robust statistics are not easily affected by outliers and extreme skew 3. Use box plots to display quartiles, median, and outliers Always start your exploration with a 2. When describing numerical distributions IV. Application exercises V. Summary
Outline I. Readiness assessment II. Housekeeping III. Main ideas 1. Analysis work flow: 1. visualization Single Numerical Variable 1. discuss shape, center, spread, and unusual observations 2. Robust statistics are not easily affected by outliers and extreme skew 3. Use box plots to display quartiles, median, and outliers Always start your exploration with a 2. When describing numerical distributions IV. Application exercises V. Summary
Outline I. Readiness assessment II. Housekeeping III. Main ideas 1. Analysis work flow: 1. visualization Single Numerical Variable 1. discuss shape, center, spread, and unusual observations 2. Robust statistics are not easily affected by outliers and extreme skew 3. Use box plots to display quartiles, median, and outliers Always start your exploration with a 2. When describing numerical distributions IV. Application exercises
Outline I. Readiness assessment II. Housekeeping III. Main ideas 1. Analysis work flow: 1. visualization Single Numerical Variable 1. discuss shape, center, spread, and unusual observations 2. Robust statistics are not easily affected by outliers and extreme skew 3. Use box plots to display quartiles, median, and outliers Always start your exploration with a 2. When describing numerical distributions IV. Application exercises
Outline Should we calculate a summary statistic or make a data visualization first?
From a past Sta 101 survey... Do you see anything out of the ordinary? How old were you when you had your first kiss? 20 15 10 5 0 10 0 5 15 20 age at first kiss 3
From a past Sta 101 survey... Do you see anything out of the ordinary? How old were you when you had your first kiss? 20 15 10 5 0 10 0 5 15 20 age at first kiss Some people reported very low ages, which might suggest the survey question wasn t clear: romantic kiss or any kiss? 3
Outline We should start our exploratory data analysis with a visualization first!
Outline Lab Hint: When asked to describe a visualization of a single numerical variable, there are four things we should always discuss. What are they?
Outline I. Readiness assessment II. Housekeeping III. Main ideas 1. Analysis work flow: 1. visualization Single Numerical Variable 1. discuss shape, center, spread, and unusual observations 2. Robust statistics are not easily affected by outliers and extreme skew 3. Use box plots to display quartiles, median, and outliers Always start your exploration with a 2. When describing numerical distributions IV. Application exercises
Describing distributions of numerical variables Shape: skewness, modality Center: an estimate of a typical observation inthe distribution (mean, median, mode, etc.) Notation: : population mean, ? sample mean Spread: measure of variability in the distribution (standard deviation, IQR, range, etc.) Unusual observations: observations that stand out from the rest of the data that may be suspected outliers 7
Outline What are some things to think about when guessing the distribution of any variable?
Clicker question Which of these is most likely to have a roughly symmetric distribution? (a) salaries of a random sample of people from North Carolina (b) weights of adult females (c) scores on an well-designed exam (d) last digits of phone numbers 8
Clicker question Which of these is most likely to have a roughly symmetric distribution? (a) salaries of a random sample of people from North Carolina (b) weights of adult females (c) scores on an well-designed exam (d) last digits of phone numbers 8
Outline Think about natural boundaries!
Application exercise: 1.1 Distributions of numericalvariables See the course website for instructions. 15
Outline How do mean, median, and skewness relate?
Mean vs. median Clicker question How do the mean and median of the following two datasets compare? Dataset 1: 30, 50, 70, 90 Dataset 2: 30, 50, 70, 1000 ?1= ?2, median1 = median2 ?1< ?2, median1 = median2 ?1< ?2, median1 < median2 ?1> ?2, median1 < median2 ?1> ?2, median1 = median2 (a) (b) (c) (d) (e) 9
Mean vs. median Clicker question How do the mean and median of the following two datasets compare? Dataset 1: 30, 50, 70, 90 Dataset 2: 30, 50, 70, 1000 ?1= ?2, median1 = median2 (a) (b) (b) ??< ??, median1 = median2 (c) ?1< ?2, median1 < median2 (d) ?1> ?2, median1 < median2 (e) ?1> ?2, median1 = median2 9
Mean vs. median Clicker question How do the mean and median of the following two datasets compare? Symmetric Mean=median=60 Dataset 1: 30, 50, 70, 90 Dataset 2: 30, 50, 70, 1000 ?1= ?2, median1 = median2 (a) (b) (b) ??< ??, median1 = median2 (c) ?1< ?2, median1 < median2 (d) ?1> ?2, median1 < median2 (e) ?1> ?2, median1 = median2 9
Mean vs. median Clicker question How do the mean and median of the following two datasets compare? Symmetric Mean=median=60 Dataset 1: 30, 50, 70, 90 Dataset 2: 30, 50, 70, 1000 ?1= ?2, median1 = median2 (a) (b) (b) ??< ??, median1 = median2 (c) ?1< ?2, median1 < median2 (d) ?1> ?2, median1 < median2 (e) ?1> ?2, median1 = median2 Right-Skewed Mean>median=60 9
Outline Why are the ways we calculate population standard deviation and sample standard deviation different? s
Standard deviation and variance Most commonly used measure of variability is the standard deviation, which roughly measures the average deviation from the mean Notation: : population standard deviation, s: sample standard deviation Calculating the standard deviation, for a population (rarely, if ever) and for a sample: Square of the standard deviation is called the variance. 10
Standard deviation and variance Most commonly used measure of variability is the standard deviation, which roughly measures the average deviation from the mean Notation: : population standard deviation, s: sample standard deviation Calculating the standard deviation, for a population (rarely, if ever) and for a sample: Square of the standard deviation is called the variance. 10
More on SD Why divide by n 1 instead of n when calculating thesample standard deviation? 11
More on SD Why divide by n 1 instead of n when calculating thesample standard deviation? Lose a degree of freedom for using an estimate (the sample mean, ?) i n estimating the sample variance/standard deviation. 11
More on SD Why divide by n 1 instead of n when calculating thesample standard deviation? Lose a degree of freedom for using an estimate (the sample mean, ?) i n estimating the sample variance/standard deviation. More uncertainty introduced by using ? instead of . All else held equal (ie. ? = ) : n n-1 gets smaller! gets larger . incorporates more variation/uncertainty. 11
More on SD Why divide by n 1 instead of n when calculating thesample standard deviation? Lose a degree of freedom for using an estimate (the sample mean, ?) i n estimating the sample variance/standard deviation.) Why do we use the squared deviation in the calculation of variance? 11
More on SD Why divide by n 1 instead of n when calculating thesample standard deviation? Lose a degree of freedom for using an estimate (the sample mean, ?) i n estimating the sample variance/standard deviation.) Why do we use the squared deviation in the calculation of variance? To get rid of negatives so that observations equally distant from the mean are weighed equally. To weigh larger deviations moreheavily. 11
Outline Center: When should we use mean vs. median? Spread: When should we use standard deviation vs. IQR vs. range?
Outline I. Readiness assessment II. Housekeeping III. Main ideas 1. Analysis work flow: 1. visualization Single Numerical Variable 1. discuss shape, center, spread, and unusual observations 2. Robust statistics are not easily affected by outliers and extreme skew 3. Use box plots to display quartiles, median, and outliers Always start your exploration with a 2. When describing numerical distributions IV. Application exercises
Range andIQR Clicker question True / False: The range is always at least as large as the IQR for a given dataset. (a) Y es (b) No 12
Range andIQR Clicker question True / False: The range is always at least as large as the IQR for a given dataset. (a) Yes (b) No Range = max - min, IQR = Q3 - Q1 12
Range andIQR Clicker question True / False: The range is always at least as large as the IQR for a given dataset. (a) Yes (b) No Range = max - min, IQR = Q3 - Q1 Is the range or the IQR more robust to outliers? 12
Range andIQR IQR IQR range range Is the range or the IQR more robust to outliers? IQR 12
Robust statistics Mean and standard deviation are easily affected by extreme observations since the value of each data point contributes to their calculation. Median and IQR are more robust to outliers. Therefore we choose median & IQR (over mean&SD) when describing skewed distributions. We choose mean & SD when describing symmetric distributions, as they are more useful in using mathematical theory to make inferences. 13
Outline How do we determine if a data point is an outlier in a numerical distribution? How do we construct a boxplot? https://www.kdnuggets.com/2017/01/3-methods-deal-outliers.html
Outline I. Readiness assessment II. Housekeeping III. Main ideas 1. Analysis work flow: 1. visualization Single Numerical Variable 1. discuss shape, center, spread, and unusual observations 2. Robust statistics are not easily affected by outliers and extreme skew 3. Use box plots to display quartiles, median, and outliers Always start your exploration with a 2. When describing numerical distributions IV. Application exercises
Box plot A box plot visualizes the median, the quartiles, and suspected outliers. An outlier is defined as an observation more than 1.5 IQR away from the quartiles (Q1 and Q3). Q3 (third quartile) median Q (first quartile) 1 14
Box plot A box plot visualizes the median, the quartiles, and suspected outliers. An outlier is defined as an observation more than 1.5 IQR away from the quartiles (Q1 and Q3). Q3 (third quartile) median IQR Q (first quartile) 1 14
Box plot A box plot visualizes the median, the quartiles, and suspected outliers. An outlier is defined as an observation more than 1.5 IQR away from the quartiles (Q1 and Q3). max whisker reach =Q3+1.5(IQR) (upper fence) 1.5(IQR) Q3 (third quartile) median IQR Q (first quartile) min whisker reach (lower fence) 1 1.5(IQR) =Q1-1.5(IQR) 14
Box plot A box plot visualizes the median, the quartiles, and suspected outliers. An outlier is defined as an observation more than 1.5 IQR away from the quartiles (Q1 and Q3). outliers max whisker reach =Q3+1.5(IQR) (upper fence) 1.5(IQR) Q3 (third quartile) median IQR Q (first quartile) min whisker reach (lower fence) 1 1.5(IQR) =Q1-1.5(IQR) 14
Box plot A box plot visualizes the median, the quartiles, and suspected outliers. An outlier is defined as an observation more than 1.5 IQR away from the quartiles (Q1 and Q3). outliers max whisker reach (upper fence) upper whisker =largest observation upper fence min whisker reach (lower fence) lower whisker =smallest observation lower fence 14
Box plot A box plot visualizes the median, the quartiles, and suspected outliers. An outlier is defined as an observation more than 1.5 IQR away from the quartiles (Q1 and Q3). 1 14
Outline I. Readiness assessment II. Housekeeping III. Main ideas 1. Analysis work flow: 1. visualization Single Numerical Variable 1. discuss shape, center, spread, and unusual observations 2. Robust statistics are not easily affected by outliers and extreme skew 3. Use box plots to display quartiles, median, and outliers Always start your exploration with a 2. When describing numerical distributions IV. Application exercises


