Exploratory Study on Impact of Food and Fuel Prices on Poverty in Sultanate of Oman
Explore the impact of food and fuel prices on poverty in food import-dependent and oil-exporting economies, focusing on the case of Sultanate of Oman. Analyze the correlation between price indices, budgetary responses to fuel price changes, and the rationale for phasing out fuel subsidies for poverty alleviation. Insights into the economic dynamics and policy implications in the context of Oman.
Download Presentation

Please find below an Image/Link to download the presentation.
The content on the website is provided AS IS for your information and personal use only. It may not be sold, licensed, or shared on other websites without obtaining consent from the author. If you encounter any issues during the download, it is possible that the publisher has removed the file from their server.
You are allowed to download the files provided on this website for personal or commercial use, subject to the condition that they are used lawfully. All files are the property of their respective owners.
The content on the website is provided AS IS for your information and personal use only. It may not be sold, licensed, or shared on other websites without obtaining consent from the author.
E N D
Presentation Transcript
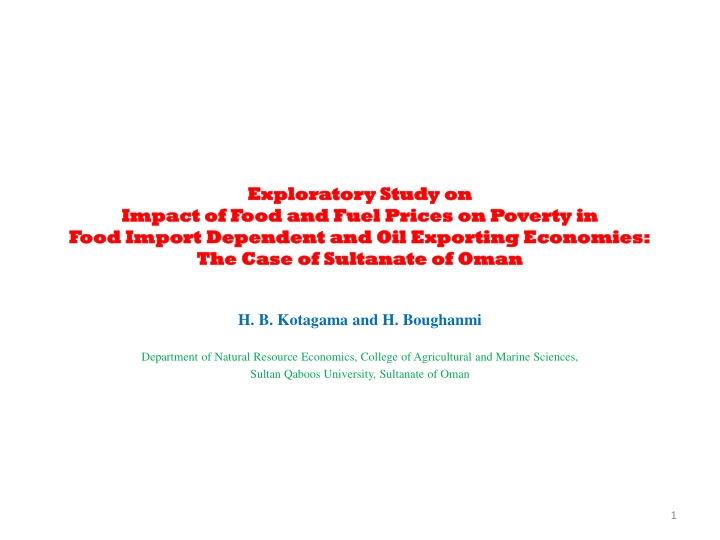
Exploratory Study on Exploratory Study on of Food and Fuel Prices on Poverty in Food Import Dependent and Oil Exporting Economies: Food Import Dependent and Oil Exporting Economies: The Case of Sultanate of Oman The Case of Sultanate of Oman Impact Impact of Food and Fuel Prices on Poverty in H. B. Kotagama and H. Boughanmi Department of Natural Resource Economics, College of Agricultural and Marine Sciences, Sultan Qaboos University, Sultanate of Oman 1
Food and Fuel Prices Food and Fuel Price Index: 2005 =100 (Source IMF) 300 250 200 Price index 150 Food Fuel 100 50 0 2000M11 2002M12 2003M10 2005M11 2007M12 2008M10 2010M11 2012M12 2013M10 2015M11 2000M1 2000M6 2001M4 2001M9 2002M2 2002M7 2003M5 2004M3 2004M8 2005M1 2005M6 2006M4 2006M9 2007M2 2007M7 2008M5 2009M3 2009M8 2010M1 2010M6 2011M4 2011M9 2012M2 2012M7 2013M5 2014M3 2014M8 2015M1 2015M6 Year 2
Impact of increased fuel prices on Oman s budget OR Million Revenues Oil & gas Other Total revenue Expenditure Deficit % Revenue Oil & gas/ Total 2015 2016 % change 9160 2440 11600 14100 2500 79 6150 2440 8600 11900 3300 72 -33 0 -26 -16 32 3
Budgetary response to decreased fuel prices Austerity proposals for 2016 Tax increases and reform Reduce public expenditure Reduce subsidies 4
Rationale for phasing-out Fuel Subsidies (Coady et.al., 2015) Remove market distortion Reduce negative environmental impacts Improve income distribution Rich benefit more from fuel subsidies Remove fiscal constraints Crowds out public expenditure that can be used for poverty alleviation 5
Rationale for the study Yet fuel subsidies remain in rich and poor countries. Poverty alleviation (poor countries) Production sustenance (oil extractors) Sharing national income (oil exporting countries) Political Oman has been now been compelled to phase-out fuel subsidies for fiscal reasons. Information on cost and benefits of fuel subsidy reform would help the government and public. 6
Fuel Subsidy reform in Oman PAST Fuel subsidy in Oman (OECD/IEA, 2015) Subsidization rate is 63% Subsidy per capita 1775 $ (682 OR) Subsidy as % of GDP 9% Fuel subsidy (untargeted) in 2015 has been 580 Million OR 25% of total subsidy expenditure Food subsidy (targeted) in 2014 has been 19.3 Million OR REFORM Total subsidies have been decreased by 64% from 2015 to 2016. The government of Oman raised gas prices for industrial users of gas by 100% in 2015 with 3% annual increase (IEA, 2015). In 2016 the government of Oman increased oil fuel prices by 33% with monthly adjustments. Estimated savings due to increase in fuel price in January 2016 (33%) to government 162 Million OR By June fuel prices have been increased by 50% (120 to 180 baisa/liter super petrol) 7
Fuel food and poverty in Oman Nationally Oman imported 44% of the food consumed, 100% of rice and about 95% of wheat. Import dependent for staples. Household expenditure on food is the largest percentage (31%) of the total household income followed with transportation (17%) that is largely cost on fuel. Thus changes in either, food or fuel prices, would have a significant impact on poverty. Poverty: In the Sultanate of Oman a family is classified as poor if it spends more than 60% of the household expenditure on food. Based on this standard 12% of Omani families were classified as poor based on Household Expenditure and Income Survey conducted in 2007-2008 compared to 8% in 1999-2000. Studies, done post 2008 surge in global food prices, have quantified the resulting increase in food insecurity in the Sultanate of Oman, measured as percentage of households unable to access Nutrionaly Adequate Socially Preferred Least Cost diet as 5.3%. 8
Objective of the study The objective of this study is to estimate the impact on poverty due to phasing down of fuel subsidy and to estimate the required public expenditure to compensate those who would be adversely effected. 9
Poverty The Model http://web.worldbank.org/WBSITE/EXTERNAL/TOPICS/EXTPOVERTY/0,,contentMDK:22586359~pagePK:148956~piPK:2166 18~theSitePK:336992,00.html Main Components Main Components Inflation ??? ??? ??????= ?????? ??????= ?????? ? ????,????,?? ?? ? ? ???? ??????? ??????+ ?????? ????????= ??????? Sectoral GDP ???/?? ?? + 1 = ????? ? ? ? ????? 1 + ?????? ?????? ????? Household consumption ???? + 1 = ???? 1 + ??????+ ?? ??? Poverty ?? 1 + ? = ?? ? 1 + ?????? ???(? + 1) < ?? ? + 1 10
Data Household Expenditure and Income Survey of the Sultanate of Oman. Central Bank of Oman National Centre for Statistics and Information, Oman Data bases of IMF, World Bank, FAO News papers 13
Income distribution and poverty in Oman Income (OR/M/HH) Less than 100 100-199 200-299 Poverty Line % of population 0.5 2.2 4.9 Spends 60% of income for food 300-399 6.8 400-499 500-599 600-699 700 and more 7.6 7.4 7.8 62.9 14
Results: Base scenario Base scenario: No increases in food or fuel prices Model output is validated with official national estimates Results are most sensitive to the poverty line. A 5 OR change in poverty line changes PI by about 3%. Estimated Poverty incidence (% HH) 12.8 Estimated transfer/subsidy to make PI = 0% (OR/Y/HH) 500 Estimated transfer to make PI =O% (OR Million) 20.4 Real transfer for food 2014 (OR Million) 19.3 Real transfer for food 2013 (OR Million) 27.9 15
Results: Actual Scenario: 33% increase in fuel prices The recent increase of 33% fuel price has increased PI by about 1% HH. If food prices are also increased by 30% PY increases by about 3% HH. The incremental cost to compensate the poor is around 0.82 million compared to the cost saving of 162 Million OR on phasing down oil subsidy (increase of 33%). A win-win policy. Simulati on: 33% increase in fuel prices Baseline 12.8 13.7 Poverty Incidence (%) Incremental transfer to equate baseline PI (OR/Year/Household) 20 Incremental total transfer required to equate baseline PI ( Million OR) 0.82 17
Results: Possible scenario: Equate national fuel prices to world prices International petroleum price 0.414 OR/Liter and Oman petroleum price 0.120 OR/Liter Baseline Simulation 12.8 23.0 Poverty Incidence (%) Yet the incremental transfer required (12.3 Million OR) is less than cost savings of reducing the subsidy (by increasing 33%) 162 million OR. Incremental transfer to equate baseline PI (OR/Year/Household) 220 Incremental total transfer required to equate baseline PI ( Million OR) 12.3 18
Implementation Win-win policy The poor impacted by fuel price increase can be compensated Fiscal saving could be used for socially worthy alternative investments Oman already has a targeted social security transfer mechanism. Hence can be done. 19
Conclusion Removal of fuel subsidies may Remove market distortion Reduce negative environmental impacts Improve income distribution Reduce fiscal constraints and release finances for socially worth expenditures. However governments have been reluctant to reduce fuel subsidies due to uncertainties of its impact on the poor. This study has shown that reduction of fuel subsidies in Oman whilst would reduce fiscal constraints, could also alleviate increased poverty due to increased fuel prices through transfers (financial or otherwise) to those adversely impacted. 20

