Explore Impact of Non-linear Averaging in Nacelle Lidar Data
Investigate the impact of non-linear averaging using high-frequency lidar data in the exploration of wind speed effects on turbine performance. Compare efficiency plots derived from different wind speed averaging methods and analyze power curves for insights using validation tools. Initial results include assessing the normality of data through graphical methods like QQ plots, examining skewness, and kurtosis statistics.

Download Presentation

Please find below an Image/Link to download the presentation.
The content on the website is provided AS IS for your information and personal use only. It may not be sold, licensed, or shared on other websites without obtaining consent from the author. If you encounter any issues during the download, it is possible that the publisher has removed the file from their server.
You are allowed to download the files provided on this website for personal or commercial use, subject to the condition that they are used lawfully. All files are the property of their respective owners.
The content on the website is provided AS IS for your information and personal use only. It may not be sold, licensed, or shared on other websites without obtaining consent from the author.
E N D
Presentation Transcript
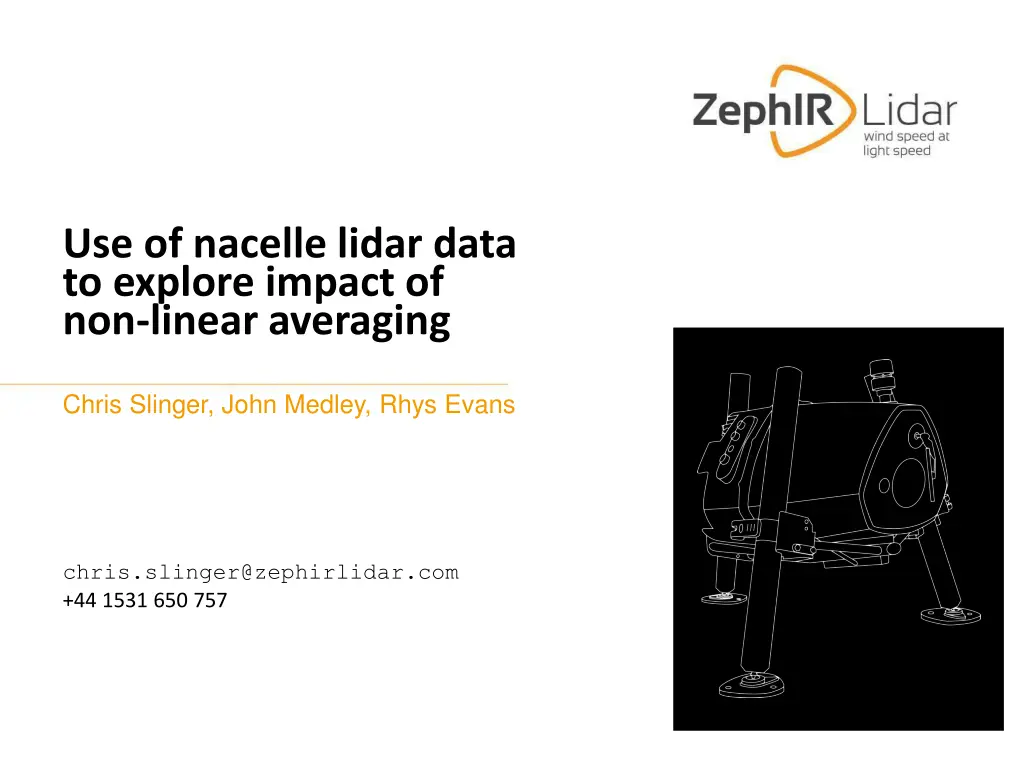
Use of nacelle lidar data to explore impact of non-linear averaging Chris Slinger, John Medley, Rhys Evans chris.slinger@zephirlidar.com +44 1531 650 757 02 September 2014
Background.From the April 2014 PCWG meeting: Existing correction methods ( , RE, TI renorm) do not fully explain observations... 10 minute mean wind speeds used Erik T xen reminded us a more fundamental measure of performance is the relationship between the turbine s electrical power and the wind s kinetic power The meeting also noted that averaging non-linear quantities can be misleading Would 10 minute wind speeds based on mean energy be more useful than existing approaches (e.g. mean wind speeds with TI renormalisation) ? 2
Aim of investigation Use high frequency lidar measurement data to investigate these effects Compare efficiency plots derived from 10 minute averaged wind speeds and those from 10 minute cubed-root-mean-cubed wind speeds Compare power curves in a similar fashion Use validation / Round Robin tools to analyse data too e.g. Power deviations as a function of wind speed and turbulence Also use high frequency lidar data to explore validity of 10 minute normal wind speed distribution assumption Normal distribution is assumed in the TI renormalisation procedure 3
First dataset to be used ZephIR DM on turbine Project Cyclops: Project Cyclops: the way forward in power curve measurements ? Simon Feeney et al, EWEA 2014 New 2 MW Vestas turbine, flat on-shore site in UK ZephIR DM on ground Use 1s data from nacelle-mounted ZephIR dual-mode lidar Use 1s data from ground-based ZephIR lidar too Collaborate with RES UK, who will analyse 1s metmast data too 4
Initial results: normality of data A graphical method of looking at the normality of a distribution is a QQ plot, comparing quantiles from the data to expected Gaussian quantiles. Gaussian data should give a straight line. Some examples are shown here: 5
Normality of data : skewness and kurtosis Skewness and kurtosis are statistics that describe the shape of a probability distribution Skewness measures asymmetry of the distribution Kurtosis measures the how peaked (or how heavy-tailed) the distribution is Kurtosis = -1.56 Kurtosis = 0.00 Kurtosis = +13.1 6
Normality of data : skewness and kurtosis Skewness and kurtosis are statistics that describe the shape of a probability distribution Skewness measures asymmetry of the distribution Kurtosis measures the peakedness (or how heavy-tailed it is) Other Normality tests are available, but a simple kurtosis filter looks easy to implement and may be sufficient let s try it and see! 7