Explore Water Quality Data Hub
Delve into water quality data through interactive exercises on the MSUEWQ Data Hub. Explore specific parameters, patterns, and relationships in various watersheds. Upload test data to experience the platform's capabilities. Enhance your understanding of environmental monitoring and research.

Download Presentation

Please find below an Image/Link to download the presentation.
The content on the website is provided AS IS for your information and personal use only. It may not be sold, licensed, or shared on other websites without obtaining consent from the author. If you encounter any issues during the download, it is possible that the publisher has removed the file from their server.
You are allowed to download the files provided on this website for personal or commercial use, subject to the condition that they are used lawfully. All files are the property of their respective owners.
The content on the website is provided AS IS for your information and personal use only. It may not be sold, licensed, or shared on other websites without obtaining consent from the author.
E N D
Presentation Transcript
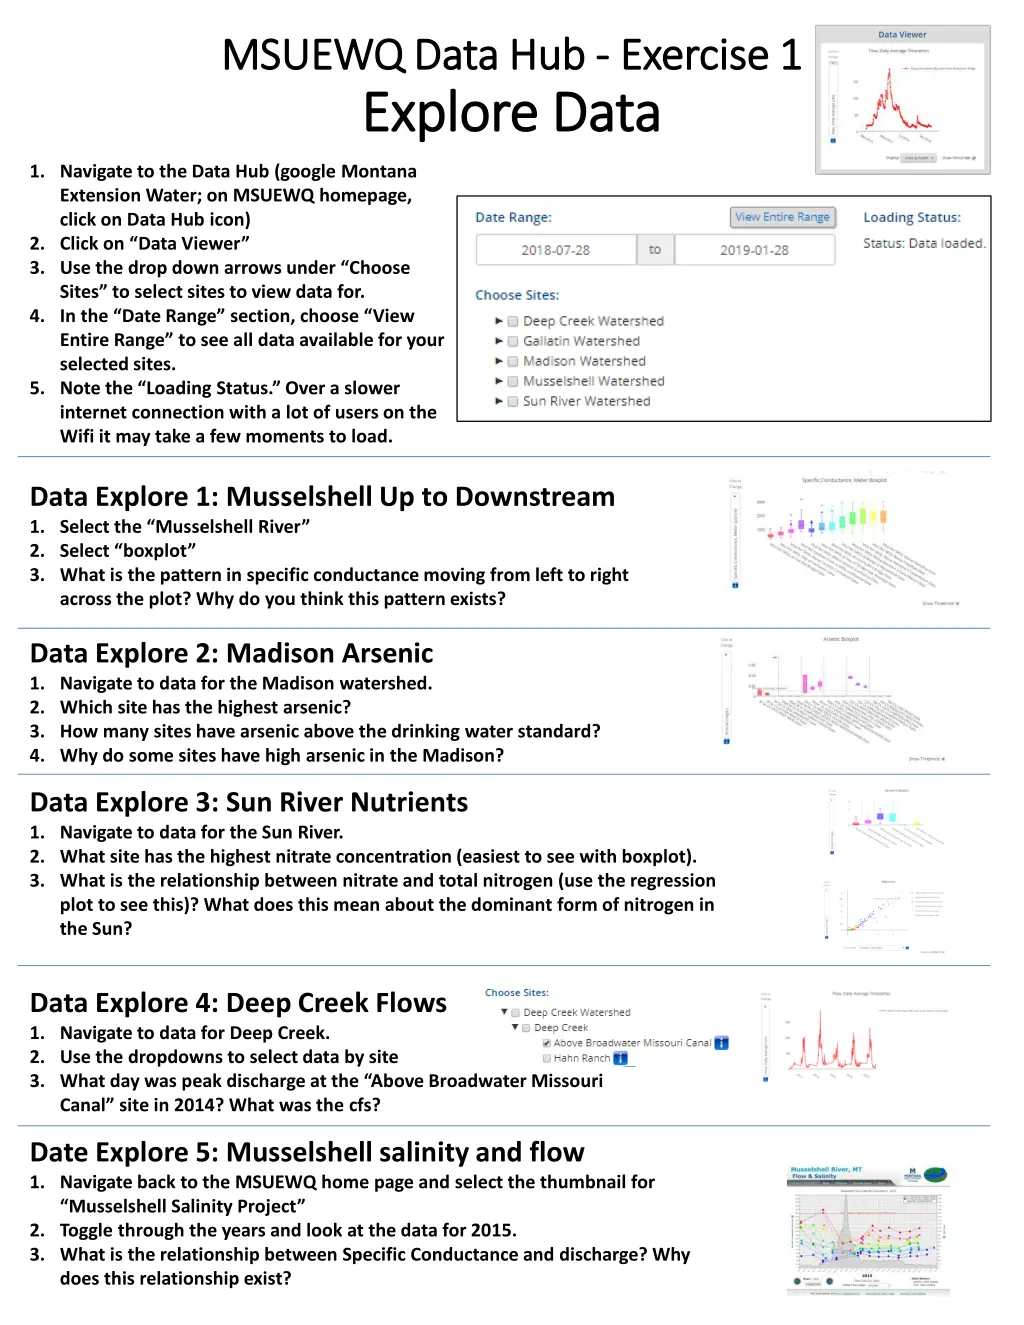
MSUEWQ Data Hub MSUEWQ Data Hub - - Exercise 1 Explore Data Explore Data Exercise 1 1. Navigate to the Data Hub (google Montana Extension Water; on MSUEWQ homepage, click on Data Hub icon) 2. Click on Data Viewer 3. Use the drop down arrows under Choose Sites to select sites to view data for. 4. In the Date Range section, choose View Entire Range to see all data available for your selected sites. 5. Note the Loading Status. Over a slower internet connection with a lot of users on the Wifi it may take a few moments to load. Data Explore 1: Musselshell Up to Downstream 1. Select the Musselshell River 2. Select boxplot 3. What is the pattern in specific conductance moving from left to right across the plot? Why do you think this pattern exists? Data Explore 2: Madison Arsenic 1. Navigate to data for the Madison watershed. 2. Which site has the highest arsenic? 3. How many sites have arsenic above the drinking water standard? 4. Why do some sites have high arsenic in the Madison? Data Explore 3: Sun River Nutrients 1. Navigate to data for the Sun River. 2. What site has the highest nitrate concentration (easiest to see with boxplot). 3. What is the relationship between nitrate and total nitrogen (use the regression plot to see this)? What does this mean about the dominant form of nitrogen in the Sun? Data Explore 4: Deep Creek Flows 1. Navigate to data for Deep Creek. 2. Use the dropdowns to select data by site 3. What day was peak discharge at the Above Broadwater Missouri Canal site in 2014? What was the cfs? Date Explore 5: Musselshell salinity and flow 1. Navigate back to the MSUEWQ home page and select the thumbnail for Musselshell Salinity Project 2. Toggle through the years and look at the data for 2015. 3. What is the relationship between Specific Conductance and discharge? Why does this relationship exist?
MSUEWQ Data Hub MSUEWQ Data Hub - - Exercise 2 Explore Photos Explore Photos Exercise 2 1. Navigate to the Data Hub (google Montana Extension Water; on MSUEWQ homepage, click on Data Hub icon) 2. Click on Photo Viewer 3. Use the drop down arrows under Choose Sites to select sites to view data for. 4. In the Date Range section, choose View Entire Range to see all photos available for your selected sites. 5. Note the Loading Status. Over a slower internet connection with a lot of users on the Wifi it may take a few moments to load. Photo Explore 1: Mandeville at Roskie 1. Select the Gallatin Watershed and Mandeville at Roskie 2. In the Date Range section, select View Entire Range 3. Above the photos, unselect General and Whiteboard Photos 4. Press the play arrow to see the slide show. 5. What date was the sod installed at the new dorms in the photo? Photo Explore 2: Musselshell Careless Channel Vegetation 1. Select the Musselshell Watershed and MSSL Above Careless Confluence 2. In the Date Range section, select View Entire Range 3. Above the photos, unselect General and Whiteboard Photos 4. Press the play arrow to see the slide show. 5. There is a small off channel pond on the right of the photo. What years is it completely separated from the main channel by vegetation? 6. During what periods does the flow look particularly high at the site? Photo Explore 3: Madison Flow Measurement 1. Select the Madison Watershed , Moores Creek and Bricker s House 2. In the Date Range section, select View Entire Range 3. Above the photos, unselect General and Whiteboard Photos 4. Press the play arrow to see the slide show. 5. What days can you verify that discharge was measured at the site?
MSUEWQ Data Hub MSUEWQ Data Hub - - Exercise 3 Upload Data Upload Data Exercise 3 Upload test data Contact ExtensionWater@montana.edu to obtain a test username and password for this section 1. Navigate to the Data Hub (google Montana Extension Water; on MSUEWQ homepage, click on Data Hub icon) 2. Click on Upload Data or Photos 3. Login using the test username and password 4. Click enter single data point 5. Select a test site and click upload data 6. Select a date and time 7. Click the You box to indicate the data is uploaded by the test user. 8. Select a variable 9. Enter a value 10. Click Check Data 11. If it looks like what you intended, click yes, upload it Check the data you entered is viewable in the Data Hub 1. At the top of the page, click MSUEWQ Data Hub to get back to the main Data Hub page. Or navigate back to it following step 1 above. 2. Go into the data viewer and select test_watershed and look for your data point.
MSUEWQ Data Hub MSUEWQ Data Hub - - Exercise 4 Upload Photo Upload Photo Exercise 4 Upload test photo Contact ExtensionWater@montana.edu to obtain a test username and password for this section 1. Navigate to the Data Hub (google Montana Extension Water; on MSUEWQ homepage, click on Data Hub icon) 2. Click on Upload Data or Photos 3. Login using the test username and password 4. Click upload photo 5. Select a test site under Photo Site and click upload photo 6. Select a date and time 7. Click the You box to indicate the data is uploaded by the test user. 8. Add a comment if you like 9. Click Choose File and navigate to the photo on your phone or laptop. 10. You can crop the file if you like by clicking on crop 11. Click Check Photo 12. If it looks like what you intended, click yes, upload it Check the photo you entered is viewable in the Data Hub 1. At the top of the page, click MSUEWQ Data Hub to get back to the main Data Hub page. Or navigate back to it following step 1 above. 2. Go into the photo viewer and select test_watershed and look for your photo.


