Exploring Applications of Voronoi Diagrams in Various Fields
Discover the diverse applications of Voronoi diagrams in fields like anthropology, astronomy, biology, cartography, and more. Learn how these diagrams aid in analyzing regions, modeling plant competition, creating maps, and studying chemical properties.

Uploaded on | 0 Views
Download Presentation

Please find below an Image/Link to download the presentation.
The content on the website is provided AS IS for your information and personal use only. It may not be sold, licensed, or shared on other websites without obtaining consent from the author. If you encounter any issues during the download, it is possible that the publisher has removed the file from their server.
You are allowed to download the files provided on this website for personal or commercial use, subject to the condition that they are used lawfully. All files are the property of their respective owners.
The content on the website is provided AS IS for your information and personal use only. It may not be sold, licensed, or shared on other websites without obtaining consent from the author.
E N D
Presentation Transcript
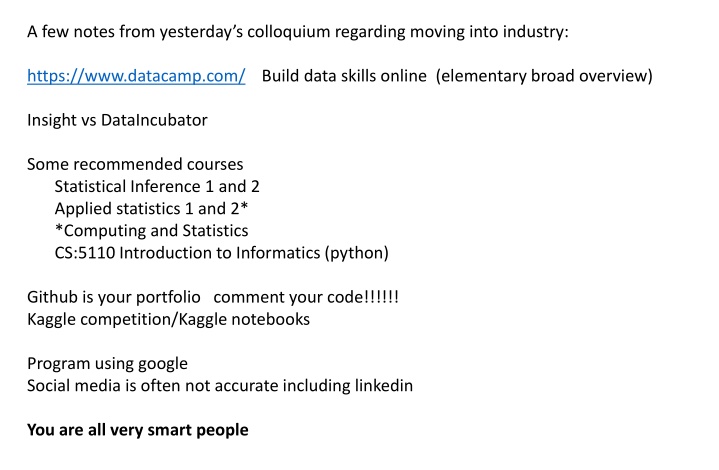
A few notes from yesterdays colloquium regarding moving into industry: https://www.datacamp.com/ Build data skills online (elementary broad overview) Insight vs DataIncubator Some recommended courses Statistical Inference 1 and 2 Applied statistics 1 and 2* *Computing and Statistics CS:5110 Introduction to Informatics (python) Github is your portfolio comment your code!!!!!! Kaggle competition/Kaggle notebooks Program using google Social media is often not accurate including linkedin You are all very smart people
Voronoi diagram: Suppose your data points live in Rn. Choose data point v. The Voronoi cell associated with v is H(v,w) w v U The Voronoi cell associated with v is Cv= { x in Rn : d(x, v) d(x, w) for all w v }
Applications of Voronoi Diagrams https://www.ics.uci.edu/~eppstein/gina/scot.drysdale.html Anthropology and Archeology -- Identify the parts of a region under the influence of different neolithic clans, chiefdoms, ceremonial centers, or hill forts. Astronomy -- Identify clusters of stars and clusters of galaxies (Here we saw what may be the earliest picture of a Voronoi diagram, drawn by Descartes in 1644, where the regions described the regions of gravitational influence of the sun and other stars.) Biology, Ecology, Forestry -- Model and analyze plant competition ("Area potentially available to a tree", "Plant polygons") Cartography -- Piece together satellite photographs into large "mosaic" maps Crystallography and Chemistry -- Study chemical properties of metallic sodium ("Wigner-Seitz regions"); Modelling alloy structures as sphere packings ("Domain of an atom") Finite Element Analysis -- Generating finite element meshes which avoid small angles Geography -- Analyzing patterns of urban settlements Geology -- Estimation of ore reserves in a deposit using information obtained from bore holes; modelling crack patterns in basalt due to contraction on cooling Geometric Modeling -- Finding "good" triangulations of 3D surfaces Marketing -- Model market of US metropolitan areas; market area extending down to individual retail stores Mathematics -- Study of positive definite quadratic forms ("Dirichlet tesselation", "Voronoi diagram") Metallurgy -- Modelling "grain growth" in metal films Meteorology -- Estimate regional rainfall averages, given data at discrete rain gauges ("Thiessen polygons") Pattern Recognition -- Find simple descriptors for shapes that extract 1D characterizations from 2D shapes ("Medial axis" or "skeleton" of a contour)
Re-partition data set into 3 voronoi cells corresponding to the 3 centroids Figure modified from https://en.wikipedia.org/wiki/File:K_Means_Example_Step_1.svg
Applications of k-means clustering: 1.) Group like items together 2.) Reduce the size of your data set. 3.) Color quantization. (a) Reduce memory use. (b) Certain devices might have limited number of colors for display.
Rstudio: library("TDA") circle = circleUnif(300, r = 1) plot(circle, asp = 1) cl <- kmeans(circle, 10) plot(circle,col=cl$cluster) points(cl$centers, pch=8, cex = 2) plot(cl$centers, asp = 1)
Many algorithms work best with normal distributions. But often data does NOT follow a normal distribution https://commons.wikimedia.org/wiki/File:Sta ndard_deviation_diagram.svg
For k-means, There are many methods for determining k. k = number of desired clusters Figures courtesy of Wako Bungula
Elbow method http://sites.northwestern.edu/msia/2016/12/ 08/k-means-shouldnt-be-our-only-choice/
https://nbviewer.jupyter.org/github/ethen8181/machine-learning/blob/master/clustering/kmeans.ipynb
https://nbviewer.jupyter.org/github/ethen8181/machine-learning/blob/master/clustering/kmeans.ipynb
If you care about closeness: Complete linkage Average linkage Ward s linkage K-means If you care about connected components: Single linkage DBscan Figures courtesy of Wako Bungula
Hierarchical clustering Data Dendrogram http://en.wikipedia.org/wiki/ File:Clusters.svg http://en.wikipedia.org/wiki/File:Hierar chical_clustering_simple_diagram.svg
Different type of hierarchical clustering What is the distance between 2 clusters? http://www.multid.se/genex/hs515.htm http://en.wikipedia.org/wiki/File:Hierar chical_clustering_simple_diagram.svg
Increasing threshold Connect vertices (or clusters) whose distance is less than a given threshold
http://statweb.stanford.edu/~tibs/ElemStatLearn/ The Elements of Statistical Learning (2nd edition) Hastie, Tibshirani and Friedman


